Yes to SB, no both positions still open
That's interesting because IG's quote has already pulled back to 42, which with a stop of 10 would have closed the trade. Has your SB quoted lower in that same time frame?
Yes to SB, no both positions still open
When to 36
long 13750
scrap that! just exited at -5
misread the market, must be Monday blues?! 😕
scrap that! just exited at -5
misread the market, must be Monday blues?! 😕
Hi chaps,
I'm short from Friday. Showing +22 up at the mo.
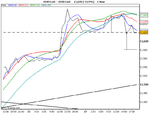
The 4 hour charts is a strong sell to me.
I'll be switching to week/day trading from now on rather than the intra-day stuff so will look at the longer time frame charts.
I have it dropping to 13580 (Cash) levels very soon.
Good luck everyone.
Hi chaps,
I'm short from Friday. Showing +22 up at the mo.
The 4 hour charts is a strong sell to me.
I'll be switching to week/day trading from now on rather than the intra-day stuff so will look at the longer time frame charts.
I have it dropping to 13580 (Cash) levels very soon.
Good luck everyone.
long 13740...
Anyone else short? I am short from 28 on the cash........come on Atilla ! Whens it going to break ? :cheesy:
Good call FW, what's you're target, if you don't mind me asking? Or is that a quick scalp you're after?
It's certainly very 'indecisive' at the moment.
I most sincerely hope you're right Atilla. The Stochs on the 4hr look promising, turning over the target line and coming down from above 90. MACD is also close to turning over, and coming off overbought on RSI. Is that what you're looking at too? 🙂
By the way, good call Friday, I'm down 20 points as I post 😢
P.S. How wide is your stop? If you don't mind me asking 😱