You are using an out of date browser. It may not display this or other websites correctly.
You should upgrade or use an alternative browser.
You should upgrade or use an alternative browser.
Bez said:Hi Hook shot ..
Thanks for the kind words, yes the time and date also gives 143 cally days from the July 18th low for Friday the 8th as they don't count the last day until its completed... I'm just including the friday as the market will be trading on its 144th day..🙂
Hope that kinda makes sense ???
I agree with monday as a pressure point as well...On these type of weekend time hits you often get a throw over first thing Monday morning, but at the mo I need the pattern just to show its hand a little more before it will be come clearer if it wants to throw over or not ...
Yep I'm clear.......cheers Bez
HS
This is another reason why I'm leaning on the Friday as a key date....
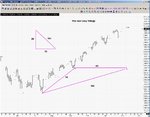
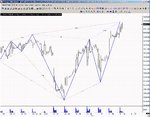
This is a snap shot from the 18th of July (SPX) just before the low 😉.... it shows how the higher frame came in on a key cally triangle count...So it favours the next higher frame will also come in on a cally count as well...

This is a snap shot from the 18th of July (SPX) just before the low 😉.... it shows how the higher frame came in on a key cally triangle count...So it favours the next higher frame will also come in on a cally count as well...
Last edited:
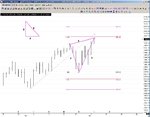
Just to help explain what I'm on about & make it bit easier ?? a chart is in order....😱 🙂
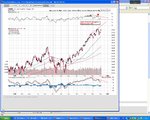
The SPX shows it better for the 8th of Dec....
Its when 3 numbers of the Fib sequence line up in natural order we get a trilogy..
1,2,3,5,8,13,21,34,55,89,144,233 ect
so we can see 55,89,144 are in perfect natrual order hence the trilogy.. 🙂
The SPX shows it better for the 8th of Dec....
Its when 3 numbers of the Fib sequence line up in natural order we get a trilogy..
1,2,3,5,8,13,21,34,55,89,144,233 ect
so we can see 55,89,144 are in perfect natrual order hence the trilogy.. 🙂
Attachments
Last edited:
andycan
Established member
- Messages
- 630
- Likes
- 28
very nice not seen that oftenBez said:Just to help explain what I'm on about & make it bit easier ?? a chart is in order....😱 🙂
The SPX shows it better for the 8th of Dec....
Its when 3 numbers of the Fib sequence line up in natural order we get a trilogy..
1,2,3,5,8,13,21,34,55,89,144,233 ect
so we can see 55,89,144 are in perfect natrual order hence the trilogy.. 🙂
one small problem im having is the OI and volume the moves up are not showing the strength one would require to bust this through with conviction
plus the divergence between the dow and sp is questionable
Atilla
Legendary member
- Messages
- 21,111
- Likes
- 4,302
Silvertip said:Ofcourse there was also the wolfewave formation during that timeframe which the SPX displayed quite clearly, although I'm sure the purists will take issue with one identifying this formation as a wolfewave in accordance with a strict definition. Another factor that helped the trader make the correct choice.
US Figures at 15:00
ISM non-manufacturing
Actual = 58.9
Survey= 56.0
Prior= 57.1
Factory Orders
Actual= - 4.7%
Survey= - 4.00%
Prior= 2.10%
Courtesy of CCM MarketMaker
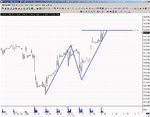
Today gets a lot off lesser hits, so its worth keeping an eye on as often these highlight lower frames that the highers could at its earlist come in with...The fib ext are what the EW'er are watching for an Exp Flat the 123.6% and 127.2%.so there are natural selling pressure points..Normally I would like to say today would be a good candate for a lower frame but with that higher time frame triangle on Friday, I'll do a Hook Shot and be "lazy" & reseve judjement for now 🙂 )
Also I'm off on my jollies soon and the minds starting to wander to beaches rather than charts 😱 🙂
Also I'm off on my jollies soon and the minds starting to wander to beaches rather than charts 😱 🙂
Attachments
Last edited:
andycan
Established member
- Messages
- 630
- Likes
- 28
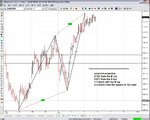
sorry mate your picture was not viewable my end for some reasonBez said:1417.75 is a key area on the ES....
Its the Measured move target on the Globex sessions and it fits both an Exp Flat count & and Ending Diag so it should very much catch the eye of the TA traders give or take a few stops..🙂
i see you already made reference to it
andycan
Established member
- Messages
- 630
- Likes
- 28
Bez said:No worries m8 ...Very nice on the square 🙂
I just did the basic measured move 😱 .....but ensign has a very hand tool that keeps track of such things on how the numbers will square up on different ratio's...
nice i just got ensign need to play with it a bit to get use to it
The ES has hit that 1417.75 to tick right on an intraday turn window....
hmm so downward pressure into the last hour would be nice...but todays one of those pesky inversion points so could still drift higher...So a stop at 1418.00 will do as a punt while I sort the cases out 🙄
hmm so downward pressure into the last hour would be nice...but todays one of those pesky inversion points so could still drift higher...So a stop at 1418.00 will do as a punt while I sort the cases out 🙄
andycan
Established member
- Messages
- 630
- Likes
- 28
good call BezBez said:The ES has hit that 1417.75 to tick right on an intraday turn window....
hmm so downward pressure into the last hour would be nice...but todays one of those pesky inversion points so could still drift higher...So a stop at 1418.00 will do as a punt while I sort the cases out 🙄
guess what Im short surprise surprise :cheesy:
Similar threads
- Replies
- 3
- Views
- 2K