You are using an out of date browser. It may not display this or other websites correctly.
You should upgrade or use an alternative browser.
You should upgrade or use an alternative browser.
On the whole the deal4free prices follow the US very closely, but they will appear wildly out if the underlying size in the market is thin (this happens a lot with ICOS). If you look at a Level2 screen next to deal4free you can usually see why their prices are the way they are. That doesn't make it any easier when they requote you though, or just fill you at a stupid price without even bothering to requote!
However, a bigger issue using deal4free to trade US, is the very small range of stocks available through them.
H.
However, a bigger issue using deal4free to trade US, is the very small range of stocks available through them.
H.
FTSE Beater
Experienced member
- Messages
- 1,518
- Likes
- 6
Hiya JT
Just remember that mytrack will only chart the last price, and therefore there could have been a large swing in bid / ask without mytrack charting it
Just a thought
eek just realized I'm defending a spreadbet company - this can not be right!! 😱
Just remember that mytrack will only chart the last price, and therefore there could have been a large swing in bid / ask without mytrack charting it
Just a thought
eek just realized I'm defending a spreadbet company - this can not be right!! 😱
BlueChip Trader
Active member
- Messages
- 165
- Likes
- 4
FTSE Beater
Experienced member
- Messages
- 1,518
- Likes
- 6
Hiya BCT
How you managed that I don't know - I had a go and it looked odd 🙄
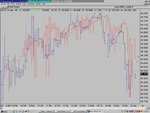
It does show how wild the spread can get and how inaccurate the D4F charts are. I personally couldn't see myself trading off them!
How you managed that I don't know - I had a go and it looked odd 🙄
It does show how wild the spread can get and how inaccurate the D4F charts are. I personally couldn't see myself trading off them!
BlueChip Trader
Active member
- Messages
- 165
- Likes
- 4
Hi FTSE B
In Photoshop select and copy red colour and paste on the other.
I see you made few dollars today in IMDC. Well done!
In Photoshop select and copy red colour and paste on the other.
I see you made few dollars today in IMDC. Well done!
GreyingSurfer
Active member
- Messages
- 173
- Likes
- 0
BlueChip Trader,
Nice graph, but I'm afraid you've made it look a lot better than it really is!
The MT graph has a range from 43.1 to 44.25 , the D4F one goes from 41.95 to 44.25! You've overlayed them withou taking that into account, I'm afraid, if you adjusted the scales the MT data wouldn't even come halfway down the D4F graph!
Good to meet this morning 😎
Bigbusiness
Experienced member
- Messages
- 1,408
- Likes
- 23
I had a short on Ariva once with D4Free. The charts were all over the place. I think they have problems with their charting software. It looked like I should have been stopped out several times but I wasn't so they obviously don't go by their own charts.
If you try buying on those big dips, they won't let you. It is a pain if you are trying to close a trade.
If you try buying on those big dips, they won't let you. It is a pain if you are trying to close a trade.
BlueChip Trader
Active member
- Messages
- 165
- Likes
- 4
GreyingSurfer
It was a pleasure and nice to see you too this morning!
You're absolutely right about the chart overlay. Sorry. 😢
It was a pleasure and nice to see you too this morning!
You're absolutely right about the chart overlay. Sorry. 😢
Good morning,
please can someone compare the d4f prices with IB , probably we need to leave the charts aside, im not sure abou American stocks but as far as im concerned d4f cfd prices for ftse100 are the in the line with the market spread.
good trading
Genti
please can someone compare the d4f prices with IB , probably we need to leave the charts aside, im not sure abou American stocks but as far as im concerned d4f cfd prices for ftse100 are the in the line with the market spread.
good trading
Genti
BlueChip Trader
Active member
- Messages
- 165
- Likes
- 4
genti
You are quiet right that D4F FTSE 100 prices are exactly the same as the market spread. I trialled level II and monitored them for a month.
However, as ianp has said getting filled at peak times can take as much as one minute. Often I have lost 6/8 points in slippage in this way.
You are quiet right that D4F FTSE 100 prices are exactly the same as the market spread. I trialled level II and monitored them for a month.
However, as ianp has said getting filled at peak times can take as much as one minute. Often I have lost 6/8 points in slippage in this way.
Similar threads
- Replies
- 27
- Views
- 8K