Day trading the DOW 10/03/03

ChartMan

Legendary member
Messages
5,580
Likes
47
I'm now going to start another series on Day Trading the DOW. It doesn't matter who you are using to deal through, the rules are the same.
Basic Rules of trading the 100MA:
Enter a trade on a cofirmation of a break of the 100MA which is when the price pulls back towards the 100MA and then continues in the direction of the breakout.
Stay in the trade all the time that the price is "beyond" the 100MA.
Exit the trade on confirmation of a TOP or a BOTTOM. OR....
Exit the trade when the price has broken the 100MA in the opposite direction PLUS 20 points.( I'll explain this when we come across it- we got an example today!)
IF you are in a trade AND the price is within + or - 20 points of the 100MA, DO NOT EXIT a trade.
I'll talk about and show you what "safe entries" are. The name of the game is to MINIMISE losses and let WINNERS run. Secondary to this is trying to to get the odds in YOUR favour of making a successful trade, as opposed to a gamble.
We'll find out what tops and bottoms we can expect to see, how we can calculate each mini move with expected targets and how we can analyse the risk we are taking by staying in a trade as opposed to exiting.
DONT look at the Spread Bet price until you are ready to close your trade. Basing your decisions on the SB price will just freak you out of a trade. Now and again, it will undoubtedly cost you a bit more as we enter a "bad" trade. Hopefully, on balance, the number of good trades will more than cover you!
Our typical targets will be 50-150 points. Those of you wanting to take a longer term view and are not averse to holding overnight, you can apply EXACTLY the same rules to the 10 Min chart with the same results.
FINAL RULE. As one door closes, another one opens- NOT!!!!
Just because we exit at a top, or a bottom, this is NOT a signal to reverse the trade. WE ARE NOT SCALPING!!!!
When you close a winning trade, sit back and congratulate youself.Take time to see if the action continues in your favour. Did you get out early? Where will we find our next entry?
All will be revealed in the next episode of Trading the DOW. :)
Which is TODAY.
 
Today's action. Let's not forget what the market sentiment is right now. It's DOWN. That doesn't mean we WILL go down. It means that at any point, if the market is not sure of direction, it will tend towards the longer term trend- Always true.
First step today was to find an entry. Those of you using freebie charts like Lycos are going to struggle to get the same 100MA line that is on my charts. ( 100 EMA by the way, although 100 SMA is just as good). Tests have shown that this value of the MA works with goor repeatability. No doubt it will work with anything between 80 and 120..... so it's not "cast in stone" NOTHING is in TA.
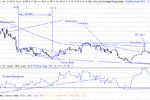
So our first entry is at 14:45- SHORT. The price has failed to make a third higher high, and we are well below the 100MA. (7670 entry, 100MA 7698). The price has made a second lower low. This is a "gamble enrty" as we have no 100MA confirmation to base our entry on. With these entries, use a half stake......
NOTE, stake size. On a gamble entry, reduce your risk. IF the 100MA later CONFIRMS your entry is CORRECT, increase your stake to "normal size" by adding another half stake.
We've entered or trade and are now going to find an EXIT. Remember, all the time the price is outside the 100MA (+/- 20) we DO NOT panick an EXIT.
So the trade is going in our favour (nice) and we see a bottom at 7630. Then the price starts going against us to 7644. No worries. We now see a lower low at 7625,so we're cool. Another rise, but this time we see a lower high.(7640 @ 15:24.)
Now check out RSI and CCI to see what gives. Any clues there? Yes there is. We are getting positive divergence. Price down, TA up. Alarm bells need to start ringing. Will this continue?
The rule for PD confirmation is that there should be 3 peaks lining up in the price AND in either RSI or CCI OR, better still BOTH.
The SECOND rule here is that the timesclae MUST be a MINIMUM of 25 minutes across the 3 peaks. As this move progresses, we see that the timescale is 38 minutes, and the 3rd consecutive peak in line is at 7620.( yes, I know, the divergence started at the open, but this should always be ignored. We're looking for symetry here.
This 3rd low is your first signal to exit the trade. Usually you MAY get one more chance to exit before the whole thing goes in the other direction, but don't count on it. Don't be greedy.Getting out on the 3rd peak of a 3 pk divergence is usually the very best EXIT.
So you should be getting out around 7625-30 @15:41. Further confirmation comes by way of the higher low at 7630 @15:50.
Now we need to look for another entry. This could be a LONG oR a SHORT. We don't care. Don't be pre-conditioned into thinking a short has to be followed by a long and vice verca!
We're now going to look for some action at the 100MA or some other TA formation that will lead us to our next entry.
The price moves on and we get a break of the 100MA... This is not enought to enter a trade. IDEALLY, we want to break the 100MA by 20 points AND get a pullback. ( this doesn't always happen!- sometimes it flies!)
The break came at 7648 and only went 6 points more. Ignore it!.
Our next entry is at 7630 SHORT, because the price dropped below the 100MA, bounced back and formed 3 lower lows. We hold through the bottom at 7610 and all the way up to 7637.... We're at the 100MA. We're in a trade and within 20 points. SO we stay in. HAD the price gone to 7655, we'd have exited at the 100MA +20. NOTE that horizontal resistance is at 7655..... In actual fact, had the price gone there, the 100MA would have moved up , to say, 7642, moving our exit up to 7662. A safer exit BECAUSE the price has gone above resistance as well. You could find that the price MAY get very close to the 100MA +20, bu be forced back down by horizontal support at 7655. You need to be aware of this "dynamic movement" on the 100MA as you approach an exit. Remember, TA is not cast in stone, You have to use a bit of skill and judgement to help you .
OK enough for this bit. Read the next thread to continue the trade.
 

Attachments

  • dow 10-03-03 1 mina.gif
    dow 10-03-03 1 mina.gif
    13.8 KB · Views: 1,456
The second short entry seems to violate one of our rules- Don't enter a trade if the price is within 100MA +/- 20. In this case there is good reason the vuiolate the rule. We have 3 lower lows, confirming a down trend following a pullback to the 100mA, even though we are within 20 points of it....
We see a loer low at 7600 and we should consider that as an important support level....We go up to test the 100MA again and see a bull flag developing. The target will take us to 7622, above the 100MA. Now things get tricky! We know we are going to break the 100MA and we have a bull flag. This is NOT a bottom. The price goes on to beyond our 100MA +20 and we should close the trade at 7638. This is a losing trade, and very unfortunate as the price immediately reverses! You DON'T know this is going to happeen, except with hind sight.At that point in time you have no choice but to close.
For your consideration...... There was negative divergence in CCI, but NOT in RSI. Had there been divergence in both, you COULD have gambled on staying in a little longer. Remeber resistance is at 7655..... very near by.
I'll cut the rest short.... There was another short entry at 7610, sam reasons as the previous entry. This time the 100MA breach did NOT stop you out, making only 100MA+12. This trade is closed at the end of the trading session at 7565 or so.
So 2 wins and 1 loss. It could so easily have been 3 wins, but that's the way it goes. Remember, the second trade was NOT a bad entry, the trade just went against us.....
We didn't make a lot of points and we didn't lose a lot either. It's not the points we make, it's the points we don't lose that will turn you into consistent traders.
PS I don't have time to check for typo's. :)
 

Attachments

  • dow 10-03-03 1 minb.gif
    dow 10-03-03 1 minb.gif
    18.5 KB · Views: 1,461
Post Script. Had we used a 2 min chart , or more, we would have stayed in the trade all day, making 100 or so points. Whether you use 1 min, 5 min or 10 min charts is up to you. Whatever suits your style. The longer timescales will capture the bigger moves, but you will need to have wider stops.You will need more patience too. Maybe you can't screen watch every minute that passes. I can't tell you which to chose. That you will have to discover for yourself. :)
Note we don't use trailing stops or any other stops except for TA /100MA rule exits. Again, this may not be to everyone's taste....
 
Chartman

First, many thanks for your time and effort in trying to help us newbies (and others )
Not being much of a scribe, I hope you do not take offence at this little lot, if it does not read as I intend it to.
With the first chart is it possible to add the time scale on it and the index values, to make it easier to study.
Also, I am having difficulty understanding the" first entry"------ " "price has failed to make a third higher high" ( it`s high is higher than the previous bar )------- " has made a second lower low " ( low is higher than previos low )

Am a bit of a dumbo, but if you don`t ask, you don`t get.

Thanks

Ken. T.
 
Sorry about that, I had a glitch last night that would have meant I lost all the work. So rather han that, I posted the chat "as is" and lost some detail. The left side time is 14:37 and the right side is 17:24. The bottom line is 7610, and goes up in 10's. So the thick line you see on the left is 7700. Hope that helps.
As for the failed third higher high, you can't see it because the chart is chopped too late.... Basically at that point in time there were two higher highs and two higher lows, indicating a possible uptrend. With the 3rd peak failing to make a third high,it signalled a possible entry as we were looking for a short entry in line with the overall trend....
 
First entry of the day coming up....
We've broken the downtrend resistance from yestreday and are looking for a pullback to this line for support- 7614. Failing that, a break above the high of 7640 to give us two higher highs and 2 higer lows AND we are abve the 100MA by 20 points. 100MA is at 7605.
15:21. Price is pulling back to the support trend line at 7614.
15:23. ES vol trend line down. Price making lower lows and 1 point off 100 MA at 810.5 expect a bounce here

15:25. Dow sitting on support at 7613

15:26. Dow testing uptrend price support at 7602. ES testing 810
CCI at zero
15:28 support lost so sit back and wait. Have a cuppa :)
watching ES now to see how far the break goes below 810- the critical number will be minus 1.25 points i.e. 808.75. below that we go down. hold there and we gat a chance to go up again. Time to sit back and look for another entry.....
 
Chartman,
Must say that your postings are really helpful, if you have the time, keep it up. As a newbie, I must admit I struggle to follow all the nuances of your thoughts. However, as I only have Lycos and Prophet java charts to use, does make things more difficult.
Thought I'd just give my ideas of my current trading system, for good or bad!
I use a 2min setup, with EMA's of 10,20,30. When they are all lined up in correct order, use that as the trend to follow for however long it lasts. My exit is when the 10 ema starts to turn, sometimes too soon I admit, but better than a losing trade As a confirmation also have DMI<ADX,MACD, and slow stochastics to look at. Nothing very sophisticated but then I am trying to use the tools I have got,
Would be grateful for any comments on improvements, or if you know a better system I could use, thaks in advance.
Kevin
 
15:37 Price now at 7580, 100MA -20 so we can look for a pulback to the 100MA at 7600 and see if we can get a short entry from it.... ES vol is divergent so we go up for a bit.... RSI bounced off 25 and CCI turned at -100, heading for zero.
15:40 price at 7586 , maybe a turn down here... entry will be 7575, just below the last low..... ES volume gone very thin so a move is coming....
15:42 Dow dropped to 7582
15:46 dropped to 7576, not enough :(
15:47 ES dropping so we may get our entry
not happy with this. RSI and CCI have positive divergence. So holding off at 7575
Although I mentioned PD or ND should have a time span of 25 mins . min., that is for a bottom or top. We are looking for an entry so a shorter timescale is important here.

15:50. This is not a clear cut entry.
15:52 still divergent, so still waiting. Divergence now across 20 minutes, making a short entry an increasingly risky entry.
 
16:12
Well, we missed out on an entry, but no big deal. 7575 would have been ok but we're coming up to a possible reversal..... A short from 7640 would have been nice in hind sight, but there was no reason to enter a short there..... Now to start looking fora long. An Inv. H&S is developing on the dow. Target 7560, hardly exciting or meaningful, except that if we get there, it's the start of a bottom confirmation...
RSI now above divergence trend line ...CCI crossed through -100 upwards.
7560 gone
Gamble entry long here.7567..... half stake.
7660 was H&S top target, now we're back above that.
add to position IF we make pullback above 7580- 100MA
Stop will be 7560 , the Inv H&S target.
Struggling at crossing point or two resistance lines.... 7570
7575 and moving above resistance.looking safer now.
holding on stop.... ES bouncing at 804.... dow at 7559
dow horizontal support at 7555...
16:33
Another bounce on RSI support line. 3 higher lows and 2 higher highs now. Long looking safe again and heading for 100MA
A 3rd higher high will take us above the 100MA and both resistance lines.
Failed to make higher high so now looking for Inv. H&S to form...
 
Not what I'd expect for an Inv. H&S, .. triangle now forming on RSI and CCI. As the price is below the 100MA completely, I'd expect this to drop so watching carefully for other clues.16:41.
Need to watch RSI and CCI for a clue.... The trend lines are in place so we may be able to call an early breakout.
16:42
if the triangle breaks, It'll be a long entry...

16:43 RSI broken , but waiting..... .... ES not broken..... CCI broken... ES still waiting :)
and we're off :)
Great call, in before the move.:)
Now I'll add to the position on the next pullback to the 100MA....
16:48 100MA at 7576 price at 7999
We're in the money.Just.... This is not clear cut so i'm going to consider a sell at 7580 which should just about get me break even.
16:55
adding another half to full stake pullback, not to 100MA, but making higher high now at 7600. Could be risky :)

resistance from yesterday :(
This is looking pear shaped- an error of judgement in missing the resistance trendline from yesterday :( A really stupid palce to add....
17:00
Not panicking yet- RSI has 2 pk divergence, none in CCI
And we're off again....
bull flag gives me a target of 7630....
A quick check on ES... testing 810 critical....
Quick check on RSI DOW, last drop to 7592 bounced right on RSI uptrend support.
RSI now showing 3 peak divergence across 17 minutes... not enough to call a top. :(
17:05
Expanding triangle forming in the price..... support 7590, res 7612
ES at Hor. res 808.....
Bull flag cancelled.
testing long term downtrend resistance. 7601
17:07 100Ma at 7585
Expanding triangle NOT made lower low, expect break to upside
Not made upside res. either. Decision time I think......
ES vol for sells divergent suggesting up.
808holding
100MA in uptrend so this may help push price support up...
CCI trend and RSI trend support gone...
RSI 52, CCI + 33
17:12
RSI has possible RS switch with support at 42.... CCI support at -17
ES 808 support gone.
Sell vol still diminishing
Dow moving to expanding triangle support line... 7588
RSI sitting on switch support.
100MA at 7585
bouncing... :)
17:16
More indecision...More later....
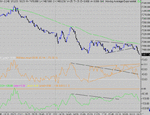
Attached is the chart for the first part of the day. Print it out a few times and start drawing the trend lines on it....... Study it well. Note my seconds clock. I use this for guestimatiing the likely volume at the end of the period. So if I see 600 after 15 seconds, I can estimate that the closing volume will be 2400..... very hady for a gamble entry confirmation.... You can only really use this in conjunction with ES futures.
 

Attachments

  • dow 11-03-03 1 mina.gif
    dow 11-03-03 1 mina.gif
    17.6 KB · Views: 1,138
Hi Chartman,

Watching this thread with great interest, very helpful to see the theory in action. I have a question, may sound a bit stupid but what is the ES you keep refering to. No need to reply while you're in the thick of it, but when there is more time perhaps you wouldn't mind explaining.

Kind regards

David

PS. Fantastic Board.

ES is the S&P 500 futures ................ very handy companion :)
ChartMan
 
Dave,

Also use the "SEARCH" facility on this site.

Pots and pots of free info. for the taking.

Good luck.
 
Thanks Chartman.

Neil, Thanks for the links, I'll have a read and add them to my enormous and fast growing collection of links and other downloaded info. I think I need a filing system for it before it gets out of hand. (already has).

dave
 
19:16. Well established channel formed. We're still in our trade and testing the 100MA band. No real signs of a drop, no signs of a top so we're still in limbo.
100MA at 7595 and price is at -11 7584. A good long term RS switch has developed and we're right on oversold at RSI 30.
Channel support is at 7575. Remember this value from the triangle breakout? It's horizontal support. It's the current value of 100MA -20 so it's crunch time......
19:21. price is turning, RSI at 27 and just dropped through support, but turning as well.
19:23. We're critical. 100MA 7593 price 9573. Big spike in buy vol on ES at 805.00 delays sell decision.
CCI and RSI turning from RSI 22
19:26 Great bounce on DOW support trend line, saving our position. This has little chance of success, but we'll see...
19:28, minor pullback moving target up 10 points to 7590...
ES 100MA at 807.75.
19:30 price at 7590. Another pullback.This could develop into a bear flag. The pull back is very close to the 100MA... this would suggest a short entry.
19:32. Pullback halted at 85 so target moved up to 95, a few points above the 100MA.This is very difficult to trade and requires opatience and skill. The 100MA is flat lining and gives us no help at all. This can go either way. :(
19:35 100 MA at 92. ES finding support at 806. Dow making a higher low.New target of 7597.
1941. 100MA 7590. price 7572. not looking good.1 point below sell point but I'm going to hold....ES supporting at 805 and RSI turning. 805 holding . Little in the way of sell volume on ES. Finely balanced. Sell vol still thin. Double bottom at 7568
19:47
19:50 basing and RSI rising nicely. ...100MA at 7585.
19:55 tripple bottom now at 7566 It makes sence to put a definite close on this at 7565 now.We're now getting pos. divergence on RSI and back above resistance.
19:59 this pullback takes us to 7580
20:01. CCI going through zero... hading to 100MA test again.
Big buy vols >3k /min.
20:05 bounce off 100MA
CCI bounce on zero. should be good....+10 on 100MA now.
ES vol 4k
20:07 Pulling back to 100MA
Getting volatile and CCI testing zero again.
Confirmation now that the RS switch is in force.
20:11 new uptrend support being tested 7581....
20:18 100MA at 7581.
Divergence now into 50 mins
CLOSED at 7555 :(
Sumary: Not an easy day to trade, Some mistakes made and opportunities missed. Still, in a sideways day like today, we didn't get pannicked. We didn't get whipsawed in and out of trades( the worst situation) and I only lost a few points. Some may argue that there were opportunities to make a decent exit "in profit" and I wouldn't argue against that. This goes against the idea of using the 100MA as a core indicator. Today it didn't play out to our advantage. Would it have been better if we went short early in the day? Probably.
I hope you have all enjoyed this. It's been fun, and hard work. I hope you have learnt how to follow a trade looking for clues along the way to support reasons why you should, or should not stay in a trade or even enter a trade. The lesson you should learn today is how to manage your trade with minimum risk. We violated our 100MA rule by a couple of points, BUT with good reason. If you can get ES futures and it's accompanying volume , it will be a great help to you.
Today was a scalpers day, with lots of points on offer, and some easy trades. Unfortunately, you can't do that on SB or CFD. If you have an IB account, no problem. But then you won't be using 100MA.....
For me , this has been an excercise in real time tracking and chatting. Great fun, but I doubt if I will have the time to do it again. Pity it didn't come good, but then that's real trading.
A final concession. Had I traded with a trailing stop of 30 points, I would have come out in profit, but I'm not complaining.
I'll update with a chart at the close.
 

Attachments

  • dow 11-03-03 1 minb.gif
    dow 11-03-03 1 minb.gif
    19.4 KB · Views: 956
A day in the life of a trader.

A trade by trade analysis ........absolutely brilliant ! :D

Well done ChartMan (we are not worthy!)
 
13:50 Looking for an entry above 7540.... or continue a short ?
15:12 short below 7480
 
This is how I would expect a bull triangle to perform when the whole of the triangle is below the 100MA...
 

Attachments

  • triangle fail.gif
    triangle fail.gif
    19.1 KB · Views: 927
Top