Bizarre happenings over the weekend really screwed up the start, more so than usual. A brave heart would have paid handsome dividends... such a huge gap had no option but to close. And so it did. Seems to me most of today was spent cashing in on the weekend's profits.... No bad news as such.....
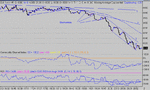
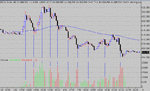
Today shows a well proven technique of finding a bottom, that has occured on numerous occaisions and timescales in the past.
The price chart displays ever increasing slopes across the tops ( marked 1,2,3,4). Mostly you will see 4 slope changes, occaisionally you will see only 3. It occurs more often looking at the 10 min charts, showing longer term bottoms, developed over several days.
Keep your eyes open for this formation, there is often little else to signal the bottom.
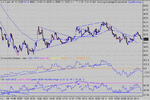
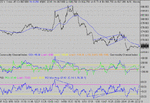
No divergences to call a top and look for a short entry . Just a "rolling top". The rolling top starts around 17:13 , continuing until 19:25. These rolling tops occur in all timeframes too. Maybe the two always go together as a pair......
Of course there is always the 4 peak positive divergence to show the bottom, but that doesn't mean tomorrow will be up. It came too late in the day to be of any use.
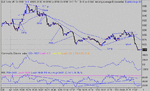
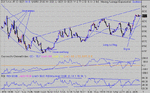
Today shows a well proven technique of finding a bottom, that has occured on numerous occaisions and timescales in the past.
The price chart displays ever increasing slopes across the tops ( marked 1,2,3,4). Mostly you will see 4 slope changes, occaisionally you will see only 3. It occurs more often looking at the 10 min charts, showing longer term bottoms, developed over several days.
Keep your eyes open for this formation, there is often little else to signal the bottom.
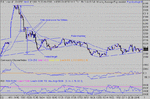
No divergences to call a top and look for a short entry . Just a "rolling top". The rolling top starts around 17:13 , continuing until 19:25. These rolling tops occur in all timeframes too. Maybe the two always go together as a pair......
Of course there is always the 4 peak positive divergence to show the bottom, but that doesn't mean tomorrow will be up. It came too late in the day to be of any use.