Day trading the DOW 07/04/03

ChartMan

Legendary member
Messages
5,580
Likes
47
Bizarre happenings over the weekend really screwed up the start, more so than usual. A brave heart would have paid handsome dividends... such a huge gap had no option but to close. And so it did. Seems to me most of today was spent cashing in on the weekend's profits.... No bad news as such.....
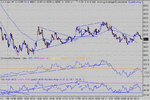
Today shows a well proven technique of finding a bottom, that has occured on numerous occaisions and timescales in the past.
The price chart displays ever increasing slopes across the tops ( marked 1,2,3,4). Mostly you will see 4 slope changes, occaisionally you will see only 3. It occurs more often looking at the 10 min charts, showing longer term bottoms, developed over several days.
Keep your eyes open for this formation, there is often little else to signal the bottom.
No divergences to call a top and look for a short entry . Just a "rolling top". The rolling top starts around 17:13 , continuing until 19:25. These rolling tops occur in all timeframes too. Maybe the two always go together as a pair......
Of course there is always the 4 peak positive divergence to show the bottom, but that doesn't mean tomorrow will be up. It came too late in the day to be of any use.
 

Attachments

  • dow 07-04-03 1 mina.gif
    dow 07-04-03 1 mina.gif
    19.3 KB · Views: 831
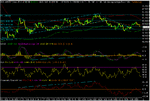
I've squeezed the chart a bit today to show some continuity from yesterday.
Well, close to a bottom , 40 points off. One of those not too common occurrences where there is good continuity across days, aiding TA analysis.
In the bottom left hand corner, you can just see RSI forming RS switches.... This providing support until around 16:50 where it switches back again to a resistance line, finally developing into an ND top from 17:50 to 19:07.Soon after this, CCI support was broken. Taking a long off the bottoms at 8260 led to a really boring day, with a few triangles showing up but none delivering anything of any significance. Even taking a reversal off the ND top gave less than 30 points after bias. :(
Not a good day for trading......
 

Attachments

  • dow 08-04-03 1 mina.gif
    dow 08-04-03 1 mina.gif
    21.7 KB · Views: 830
Hi Chartman,

I'm using Sierracharts in much the same manner as yourself for Dow trading, but I find using Bollinger Bands and MACD on screen very good for fine tuning entry/exit points - any comments on this kind of setup?

Regards, TradeSmart
 
Hi CM
It's funny that when you have "seen" one pattern you miss others.

I sat watching the large ascending triangle from ~1600 until it broke to the upside at 1803. So I jumped in and then saw the pattern immediately fail and reverse!

Are there any clues I should have seen that would have told me that this was unlikely to complete with a target of 8400??
 
No. And for what it's worth, I did exactly the same as you. My only decent trade of the day was the rise from 8260 to 8320.
 
just wondering what made you enter that trade CM.....looking at the chart i can't see (other than with benefit of hindsight) why you might have entered there.
 
Hi Chartman,

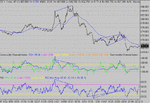
I've attached yesterday's Dow chart showing my screen setup; similar to yours, but making use of Bollinger bands, MACD and Fibonnaci; all of which I find to be useful entry/exit indicators. Any comments/critisisms of this setup would be welcome, as I haven't been using it long, but the results are very positive so far.

Regards, TradeSmart

ps chart attachment has lost a lot of clarity with broken lines, so please advise on the best way to do this also!
 

Attachments

  • dji 9-4-03.gif
    dji 9-4-03.gif
    21.4 KB · Views: 793
Last edited:
ED - I make mistakes like everyone else :(

TradeSmart- try setting the background to a light colour- may be a real pain though!
 
ChartMan,
I'm still having problems with the chart - still getting broken lines, but anyway, maybe you can see from the fuzzy image why I find the B.Bands/MACD/Fibonnaci to be useful indicators.

Just had a nice 'long' 8290 - 8380, but it was easy with all the indicators pointing in the 'up' direction; also one of the indicators was the time (it was 9.50 ET!)

also confirmation from events in Baghdad.......! :)

Regards, TradeSmart
 
As mentioned elsewhere, as easy day to trade today, with about 250 odd points on the table. If ever there was a good example of " buy the rumour, sell the news, this was it. The quick rise up to 8380 was on the rumuors of the war being over. The drop was on the reality that in fact it wasn't..... The other way to look at this is that a news spike will be short lived, with the price returning to it's previous state, in this case downtrend. And so it did exactly that. So two good longs and two good shorts, but needed careful scrutiny of TA to get the best out of it, although the 100MA did pretty well overall. Hopefully, those that have been following this series will now be getting to grips with optimising entries and exits- taking the double top as a flip trade instead of wating for the safe short entry and taking the divergent bottom for a cover and go long.
 

Attachments

  • dow 09-04-03 1 mina.gif
    dow 09-04-03 1 mina.gif
    20.7 KB · Views: 686
ES 5 min vol chart. A good example of how to trade off volume.
 

Attachments

  • es 5 min vol.gif
    es 5 min vol.gif
    20.5 KB · Views: 615
And here's why trading/watching the ES futures pre market is good for your health. This showed clearly a 3 peak ND top, not seen in the DOW ( just a double top).
 

Attachments

  • es 09-04-03 1 mina.gif
    es 09-04-03 1 mina.gif
    21.8 KB · Views: 638
Not a lot of excitement today.... about 60 points off the opening short and the same off the long. Another day for the scalpers....Closing at HOD may make for some upside tomorrow.There was just enough time for the long bull flag to make target (8220).
 

Attachments

  • dow 10-04-03 1 mina.gif
    dow 10-04-03 1 mina.gif
    22.6 KB · Views: 597
Chartman,

thought u may be interested. I spent the past 2 weeks in Brasil (well mostly indulging in activities other than trading), but on a couple of cloudy days, traded Bovespa. Your analysis and insights work tops - on an emerging market index! many thanks again!
 
hi chartman,
I really don't like those alternating long white/black candlesticks coupled with that broadening structure fron 1700 to 1800.
The potential for getting whipsawed was too great.
How did you call the first short? It was too early to plot a trend, guess you used a continuation of the previous day?

Best Regards,,
Neil
 
Yes Bansir, when the futures don't move much overnight, then one can assume ( rightly or wrongly) that the prior trend will stay in force for a while. The sensible thing is to wait for a second lower high and then decide. Don't go shorting if RSI <20 odd ad CCI > -200 ( ie -250). RSI was at 40-60 and CCI was at -100 to -150 ish so relatively safe.
 
Just a quick report tonight. The initial drop fellshort of it's target, signaling a long opportunity..... That was about the sumtotal excitement for the day. The rest of the day was just a mess of nothing, going nowhere fast. Today was one of those days where any decision was likely to have been the wrong one. :( Myself included.
 

Attachments

  • dow 11-04-03 1 mina.gif
    dow 11-04-03 1 mina.gif
    22 KB · Views: 409
Good Morning Chartman
Your post of 03:01 yesterday "When the futures don't move much overnight", could you tell me where to view these. I have Sierra Charts with a Mytrack basic and Sierra subscription so I get live indices but delayed everything else. D I need to upgrade my sub. to Mytrack.
Great posts, they really help to put all the theory into practice.

Kind regards

David
 
Yes, you need to sybscribe to cmeLimtd in MyTrack/functions/chat/entilements- $15 a month I think.
take nasdaq at1$ as well.
 
Top