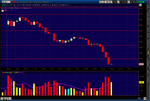
Day Trading and Your Life.

What I see here is a chart that over an 8 hour period you have managed to draw 14 horizontal lines.

The chances of a bar with a higher than average volume intersecting one of these lines is obviously high for no reason other than the fact that there's very little chance of any bar not hitting a line.

Why not actually give something substantive on volume analysis.

Mr. DionysusToast, please look closer and think a little bit, use your brain.
 
What I see here is a chart that over an 8 hour period you have managed to draw 14 horizontal lines.

The chances of a bar with a higher than average volume intersecting one of these lines is obviously high for no reason other than the fact that there's very little chance of any bar not hitting a line.

Why not actually give something substantive on volume analysis.

By the way, Mr. DionysusToast, I know you can do better, but there is something blocking your visual range, open your mind a little, if you do, some day you will be able to understand and trade better. You have to OPEN your mind.
 
Here is another example on volume and price movement relationship.
 

Attachments

  • 2010-11-06-TOS_CHARTS.png
    2010-11-06-TOS_CHARTS.png
    52.9 KB · Views: 360
For those who do not believe in volume and price structure relationship, look at the chart below, there are many trading opportunities, of course you can spot those if you have an open mind and you are willing to learn about the real deal behind day trading. Again, price structure and volume analysis is all you need.
 

Attachments

  • 2010-11-12-TOS_CHARTS.png
    2010-11-12-TOS_CHARTS.png
    32.9 KB · Views: 338
You have a chart with price and volume on it, you can see the move, it is late for you to enter, it is the open of a trading day, the price goes away from your entry zone, there is no time, the move is too fast, suddenly you can see a tremendous increase of over average volume, you think this is the beginning of a move and it is a good time to enter. Think again, you are wrong.

I have seen this picture over and over again, never enter the market on an explosion of volume, it is too late, the party is almost over. That is one of the reason I say you must study volume and price structure to see what is about to happen, many people have lost hundreds of dollars playing the markets, one thing they have in common, they never look at volume. It takes time to learn how to understand the language of volume, once you do, a world of opportunity opens to you.
 
Last edited by a moderator:
Yes, it is the only way; in day trading any market, price and volume are your only lines of defense and attack. As I have said before in my blog, during the day you have to pay close attention to price candles and their volume, the party always begins with clues, you are to discover those clues. Let´s take a closer look at the chart below, at 11:50 am you can see an explosion of volume (way over average) but price does not advance much, in fact, very little, what is wrong here?. After that, at 11:55 am the price breaks below the low of a doji candle, who is selling that much ?, my friends, this is the GREEN LIGHT to go short, you are back up with volume in a short play, look what happened after the low of the doji candle was broken. Think about it… you can become a master day trader.
 
Last edited by a moderator:
You imply that day trading is all about trend following.

This is total nonsense.

Not All about trend following, DT, but a good porcentage of the time, certainly enough of it to have significant importance to me.

Hey! I don't know where Malaspina is coming from, I've only got up to #4 of the thread, so don't rip me off for what comes after! :D
 
Hello! I'm a new one here. I use volume as my trading strategy and just want to poin out that it is always necessary to wait when big boys accumulate a big amount of volume. They never lose their money.

Volume figures on interday trading are manipulated so that you get them too late.
 
Volume figures on interday trading are manipulated so that you get them too late.

Never heard that one before....

All trades that occur in a market are reported when they occur.

In the stock markets, 2 participants can negotiate a large block trade at any price they like and that will be reported through the course of the day.

In the stock markets, we also have dark pools whose trades are definitely reported late.

Apart from that - all transactions on a market are reported when they occur. I do not see how volume could be manipulated here and this is the bulk of the trading too.

Care to enlighten?
 
Problem with trend trading is you only know after the event there was a trend.

Not so, although we all get it wrong, too. Trying to catch a trend at the start is a dangerous game. There is is an area where the probabilities of a continuance reduce the risk involved.
 
Yes, it is the only way; in day trading any market, price and volume are your only lines of defense and attack.

Now we've gone from Volume being relevant to volume & price being the only useful tools.

An increase in volume without a price move can be significant but there is much more detail available. Consider the following:

1) Increase in volume, no movement
2) Increases in volume, that volume is mostly market sell orders and yet price isn't moving down and the bids are being refreshed

The 2nd scenario gives you a lot more information than volume alone could every supply. Volume alone is fairly useless. Of course, if you've not used the tools that show you scenario 2, then volume may seem useful. Relatively speaking, it's a pretty blunt tool.
 
Last edited:
Day trading emini NASDAQ 100, patience and action.

Day trading emini NASDAQ 100, patience and action, it is the title of this post and you better take a closer look at these two words. It is very boring to stay all day watching a computer screen waiting patiently for the right set up to enter the market, but it is the way things work in this emini day trading world and for any person day trading any market. You must wait until you have all your confirmations and then and only then you will take action. Most people can not do it, the just feel the need to be in the market day trading at all times, this just increases the odds of losing money. What point does it make to win some money in a trade to lose it later during the day?. You must keep the money you already won playing the markets and the only way to do that is to play only when you have green light from all your parameters and to reduce risk as soon as you are in the market.

Remember, if you really want to make a living out of day trading you have to pay close attention to the paragraph above, what the market gives the market takes back if you are not carefull, and the worst is that at the end of the month not matter how good or bad you have traded, the bills will be in your mail box waiting to be paid for you.
 
It is very easy to talk about how you could have taken a trade after the fact, hard is to trade in real-time. So, how can you put your money at risk if you do not have an edge ?. This is a key question to answer when day, swing or position trading. From my point of view, analysing price structure and volume is the way to go. For me, trading is an art, so you have to tone your skill studying your niche market everyday in order to get to know it´s behaviour.

I wont´t talk you about entries and exits after the fact, but if you take a closer look at the next chart you can see two key areas of support and resistance + volume that clearly played and important role in this day trading. Please feel free to drop any comments about it.

2010-12-08-tos_charts.png
 
Today I want to share with you a very common price structure seen every day in trading any market, it is called double bottom. Again, I won´t tell you how to trade it, how you get in and out of a trade is very different from one trader to other but the core idea is the same. You can notice how the first bottom was made on high volume on a reversal candle, minutes later the same bottom is tested again in lower volume on a reversal candle, there you have a clue about where and when to enter your trade and the resistance levels will let you know if to take all profits or partial profits. It is that easy, you have to keep it simple, it is the only way to win this game.
 
Last edited by a moderator:
I'm not sure I agree with the original poster, definitely in stocks the trend is your friend however in forex we have the freedom to get in earlier as we don't have to wory about covering commisions.

I like to trade around pivot points and when entering a trade I'm hoping for a bounce. I'll always take the trade at the very beginning of the bounce, this is coin flip mentality however a tight stop loss at the beginning means if the trend goes against you the losses are small and thus I can afford to get it wrong.

Day trading shouldn't be stressfull as with a decent strategy you shouldn't have major losses or drawdowns. I suppose it depends on the type of trader you are, I see guys chasing the big pips but I'd rather place a few small trades grabbing 30 pips here and there with my emotions in tact.

For me it's not about the money, it's about proving to myself that my strategy is sound, I'm only trading with a tiny pot and that pot came solely from stock trading profits. My stocktrading well earns my bread and butter money affording me this time to play around in the forex markets.

The small amount of indis I use (THV system) are very reliable so far.
 
The two most important trading indicators.

Price and volume are the two most important indicators. I already forgot about the rest of them. When trading these two elements can give you clues about what it is going to happen, these are not 100% bullet proof but they are right over 80% of the time, think about it. It is not easy to look at a chart and notice what the price and volume are saying, it takes time and a trained eye to notice but with persistence you can reach that level of expertise. I have provided again a chart that explains the topic, please take a look at the price and volume divergence area signaling the end of the move. Review the chart and make your own notes.

pricevoludiver.jpg
 
Today, I am going to explain why having patience in waiting for the main areas of support and resistance to get stablished during the first minutes or hours of trading will pay you a lot of money. In order to trade efficiently you have to know the price structure of the market, it is not easy for many to wait for this to happen but if you don´t do it you can kiss good-by your trading account.

During the first minutes to hour of trading (characterized with high volume) will define the first areas of support of resistance of the day, these will guide you where to enter or to exit the market, you have to wait patiently to see how prices behave around these levels in order to take your position accordingly. This is more easier said than done, but it is one of the only methods that works to make money in the market.

Once these areas of support and resistance have been drawn you will have in front of you the face of the market, a landscape of the current situation of price behavior and this is what I call price structure. You need to learn how to understand price structure in order to get your trades with the flow in your favor, not against you.

Finally, support and resistance are made with two ingredients which are price and volume. That is it. Those are the only two indicators you will ever need to trade. This will make your trading simpler, easier and more productive.
 
Today I am sending you a chart explanation of price action trading, putting all concepts of price and volume (Support & Resistance) together. I won´t say much here, all is in the chart and in my previous posts. To tell you the truth, this is all there is (in general terms) about my day trading strategy. All is very repetitive, and boring, but it is the away it is. Please do not try to make things complicated adding some strange technical indicators to it, it only will mess it up. Take a look at the chart, make your own notes and study it in detail, you will discover the message behind the chart.
 
Last edited by a moderator:
Never heard that one before....

All trades that occur in a market are reported when they occur.

In the stock markets, 2 participants can negotiate a large block trade at any price they like and that will be reported through the course of the day.

In the stock markets, we also have dark pools whose trades are definitely reported late.

Apart from that - all transactions on a market are reported when they occur. I do not see how volume could be manipulated here and this is the bulk of the trading too.

Care to enlighten?

Hi DT,

I had an earlier thread that was moved to another section. Anyhow, it had a question about volume that perhaps you can answer. In the US, volume executed in ATS such as dark pools are required to be reported to the Trade Reporting Facility (TRF) within 90 seconds. I have seen estimates of total dark pool volume being somewhere around 10-15% of the total market volume. But on most days, TRF volume is around 30%. So where are the remaining ATS trades coming from?

I'm just an ordinary retail trader trying to absorb all the knowledge and it would really be useful to know where that liquidity is.

Thanks for your help.

PS.: I also had a second question that dealt with different market makers in the US - Citadel, ATD, UBS. Do you know anyone on this forum who may be able to help me with the details? Someone with extensive experience scalping or doing high frequency trading perhaps.
 
Double bottom spotted, this is a real-time trade I took this morning. It is very clear on the chart. You can see it from miles of distance, when this happens you have to take action, remember, there is no good in a trade that you can see and no action is taken. Take the risk, control it, make money. That is the right sequence of action. Please drop me a note if you can detect it in the chart bellow. You will notice the volume divergence and how price showed the way of the trade.

.
 
Last edited by a moderator:
Top