Daily News Analysis By Ultima Markets

Trade war risks intensify, putting pressure on the US dollar and limiting the upward trend of US stocks​

US-China trade relations remain a central focus for global markets. Former US President Trump’s latest comments, including the possibility of imposing a 100% tariff on Chinese imports and a tough stance on China’s rare earth export controls, have further exacerbated tensions.

Against this backdrop, the market is balancing optimistic expectations of further Federal Reserve easing on the one hand, and lingering trade risks on the other. This intertwined situation has led to cautious market sentiment, which could quickly shift to risk-off mode if trade tensions escalate.

Market Outlook and Technical Analysis

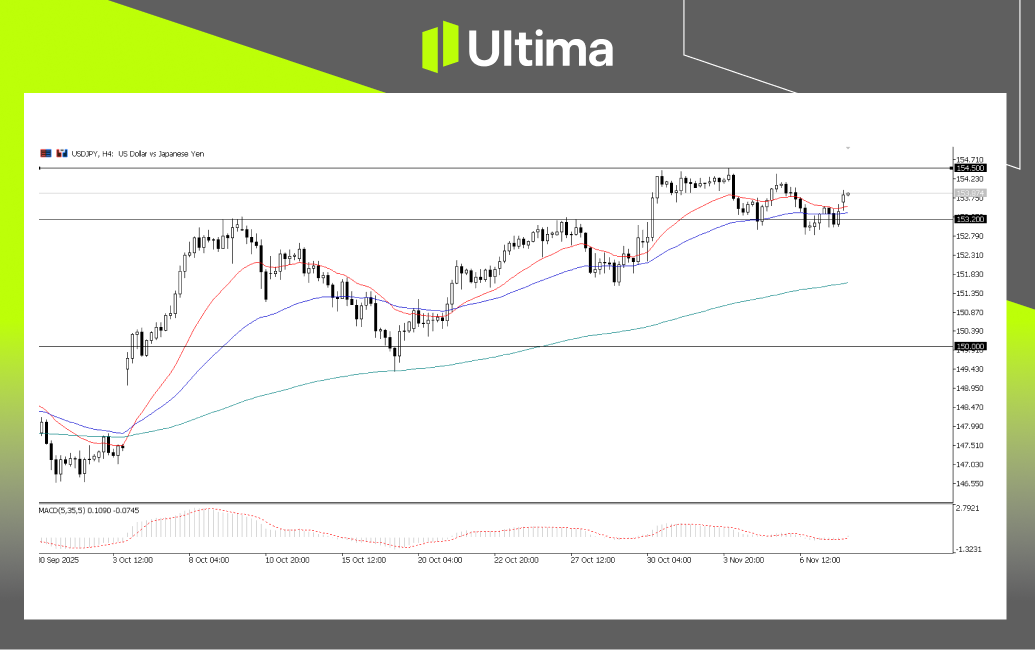
US dollar: Continued pressure from dovish sentiment

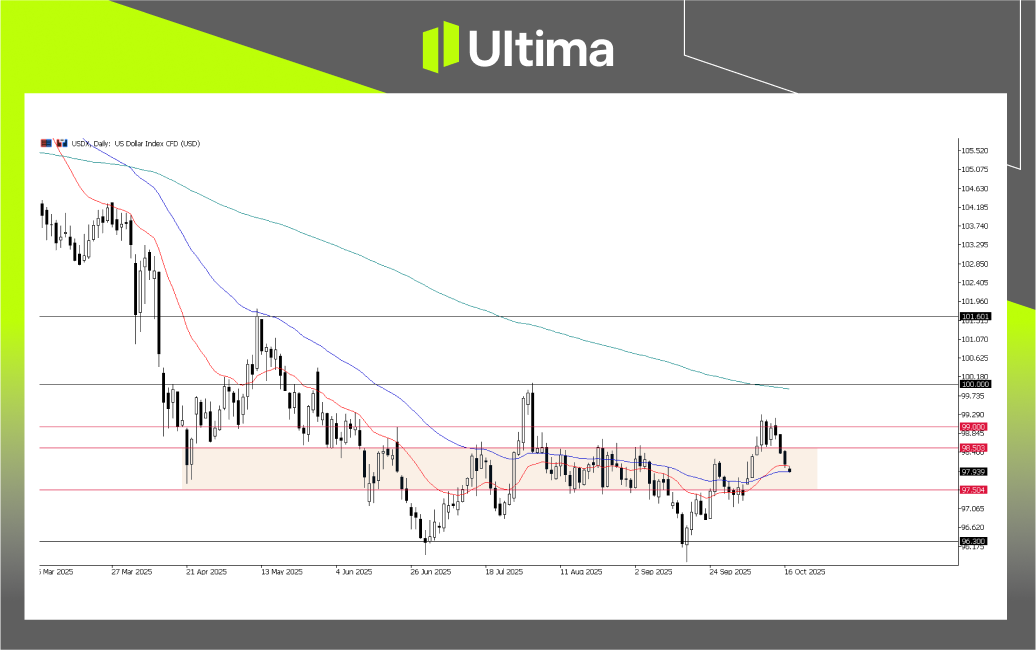
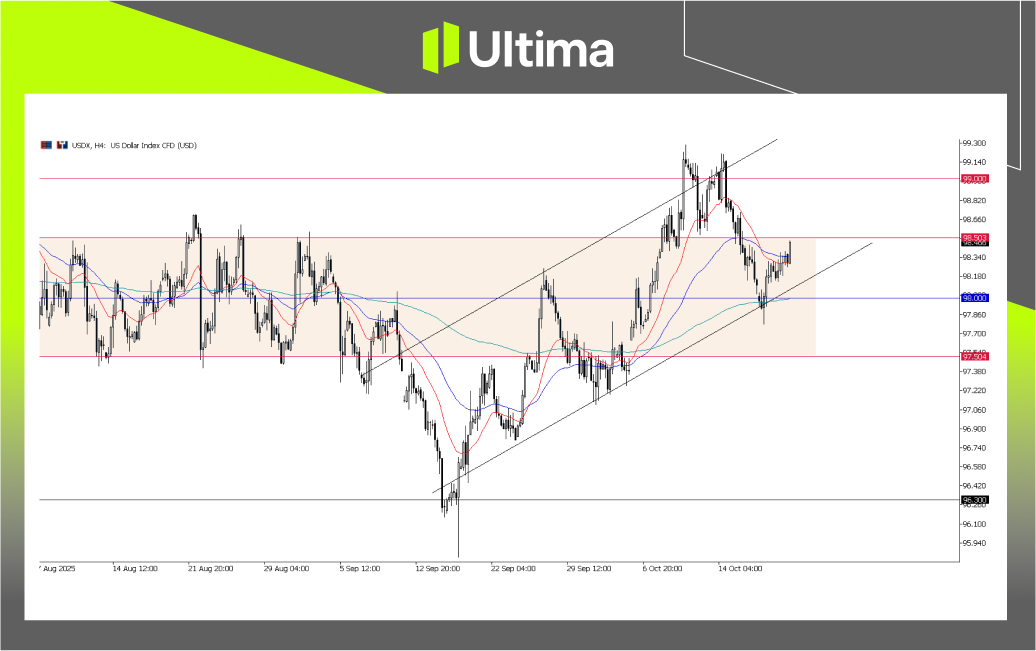
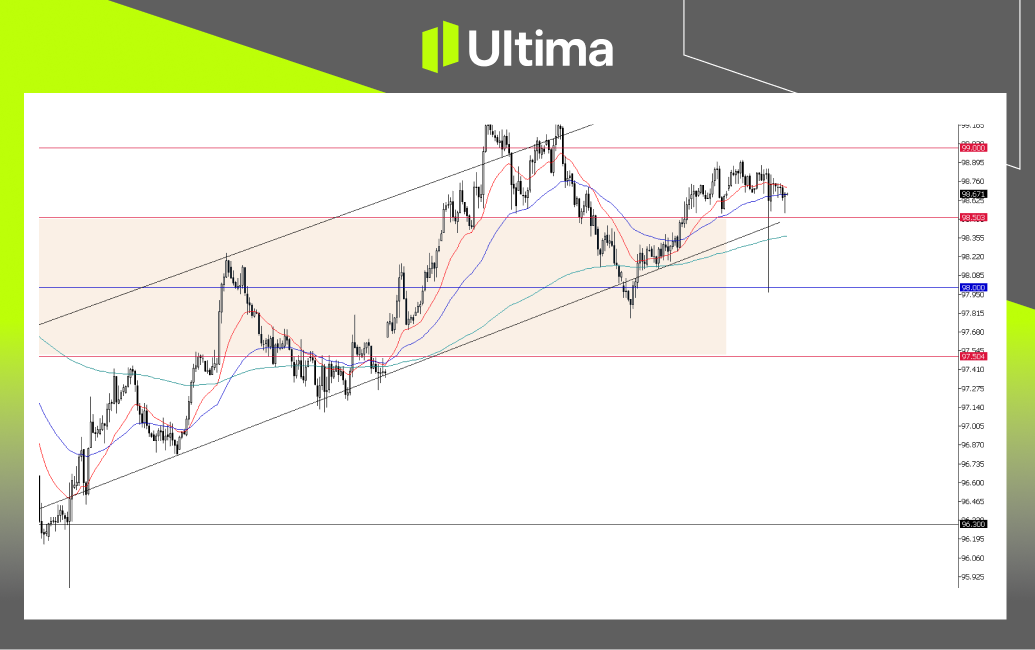
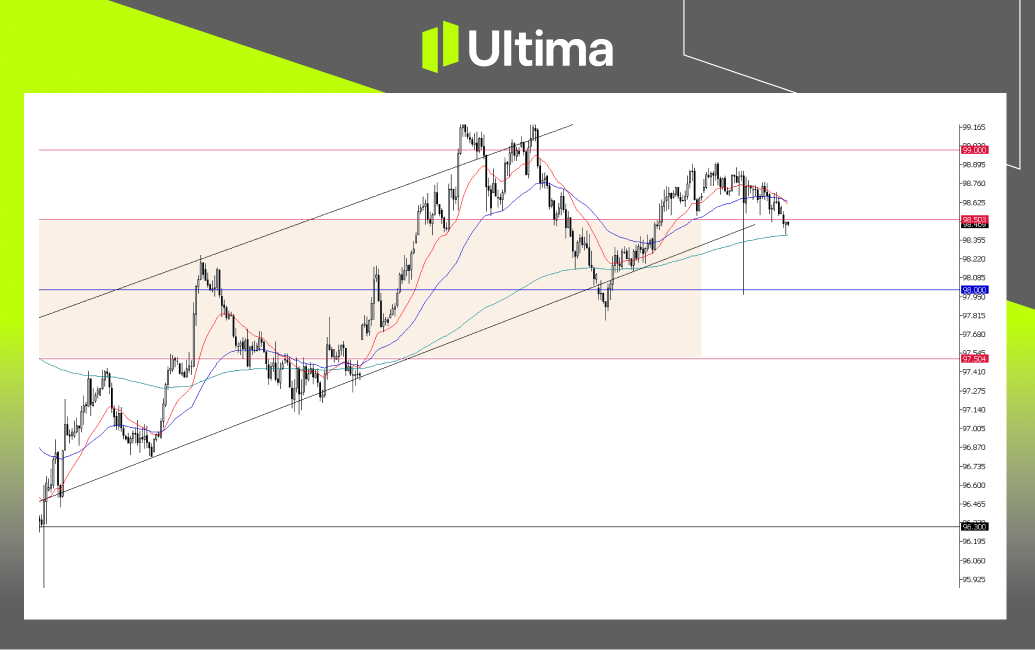
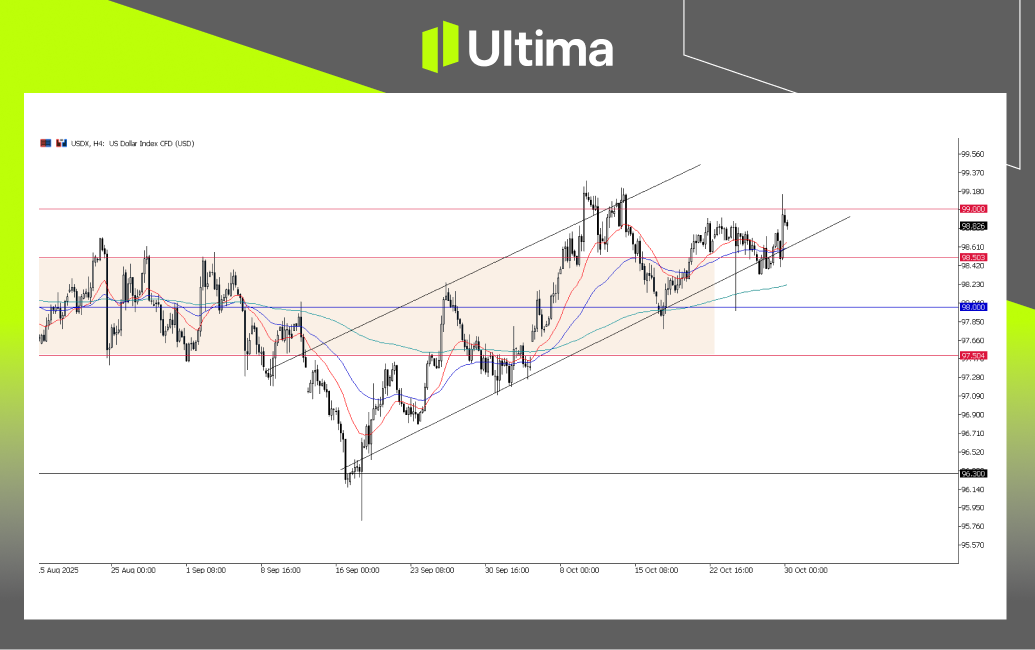
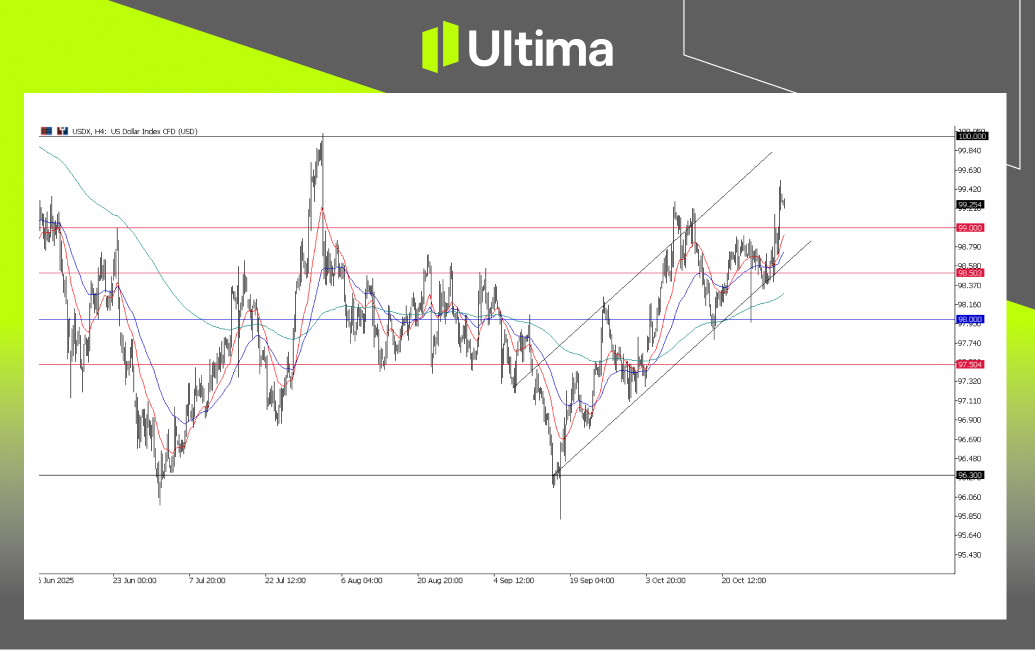
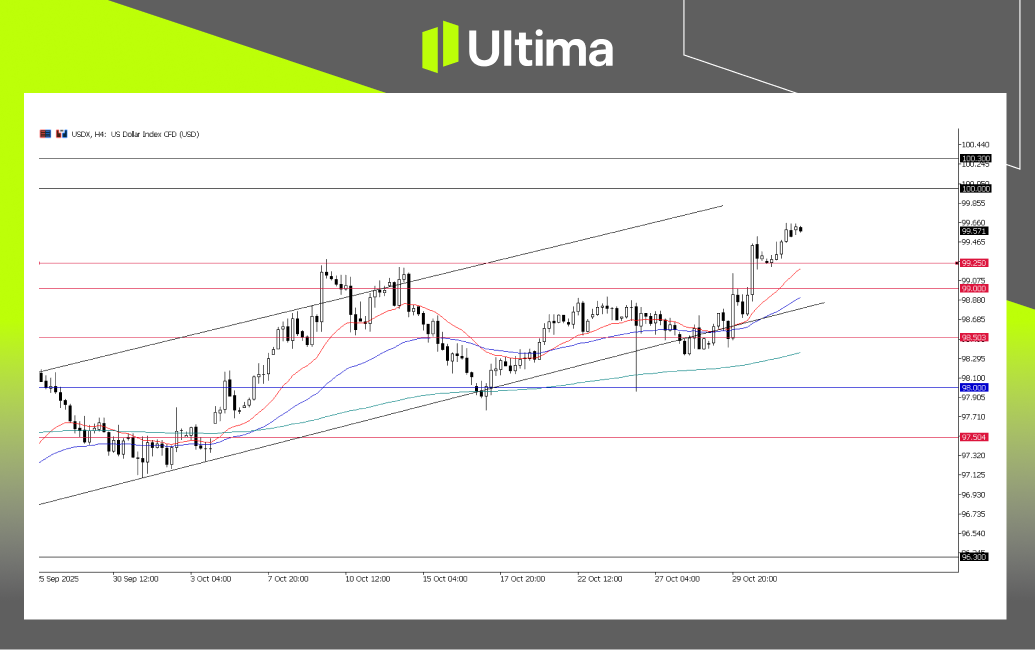
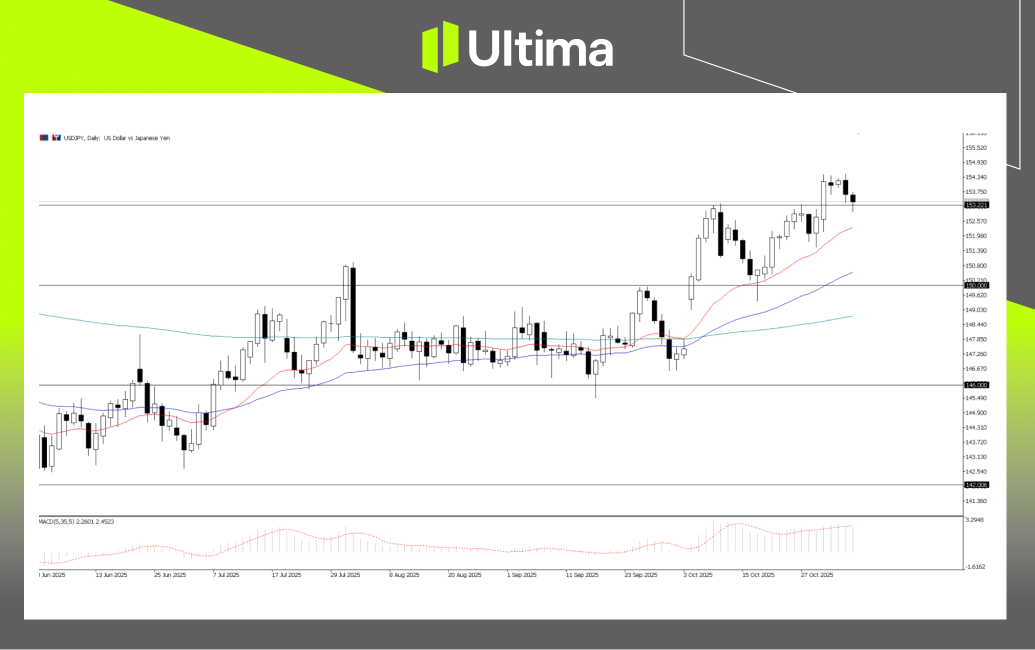
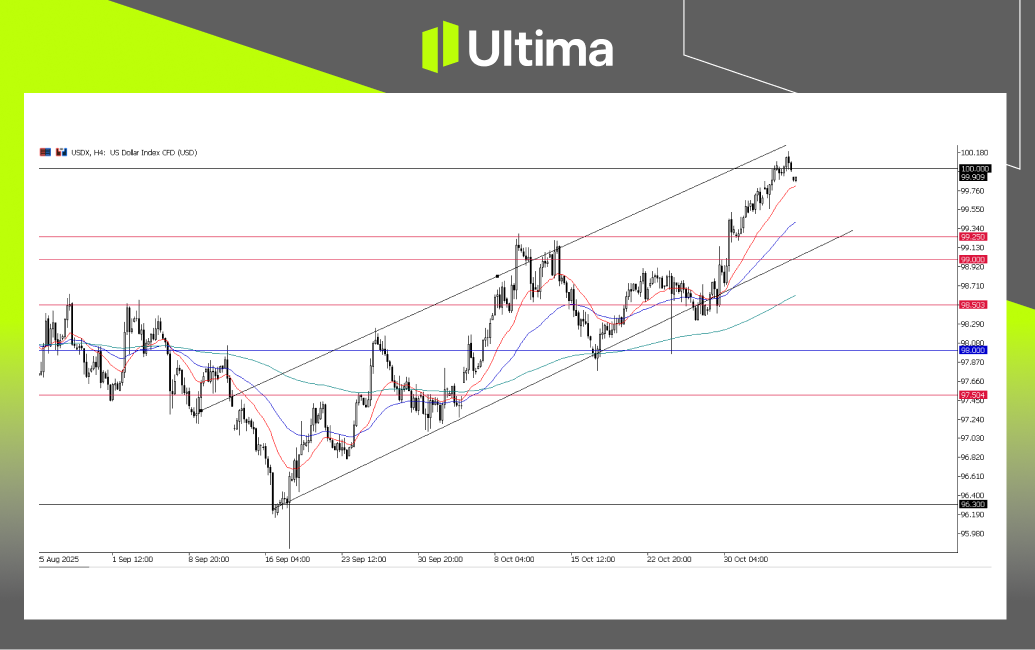
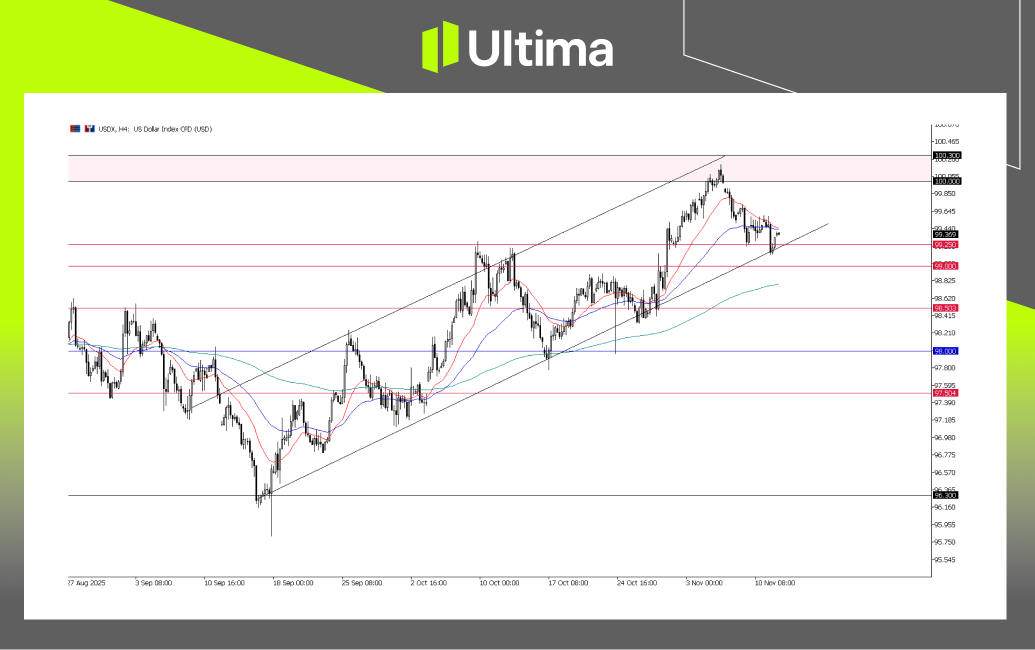
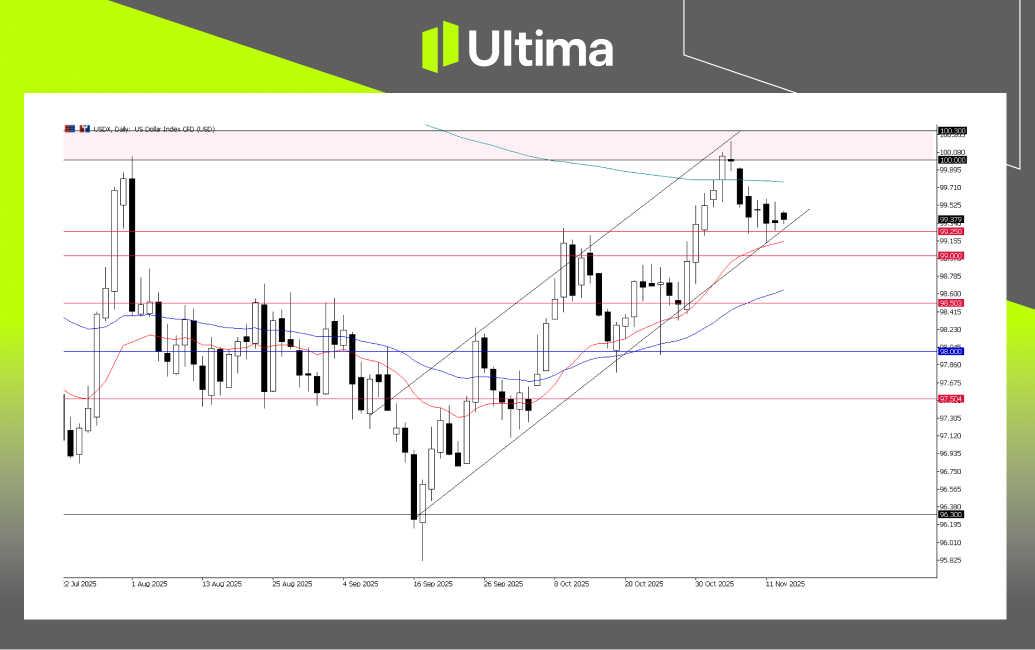
Federal Reserve Chairman Jerome Powell’s earlier dovish comments continued to weigh on the dollar. He cited a significant slowdown in job growth and increased downside risks as reasons for the Fed’s shift to a more accommodative policy stance. Markets are currently pricing in two more rate cuts this year.

From a technical perspective, the US Dollar Index (USDX) has fallen below the key support level of 98.50 . This is seen as a bearish signal , suggesting that the US dollar may enter a deeper correction phase.

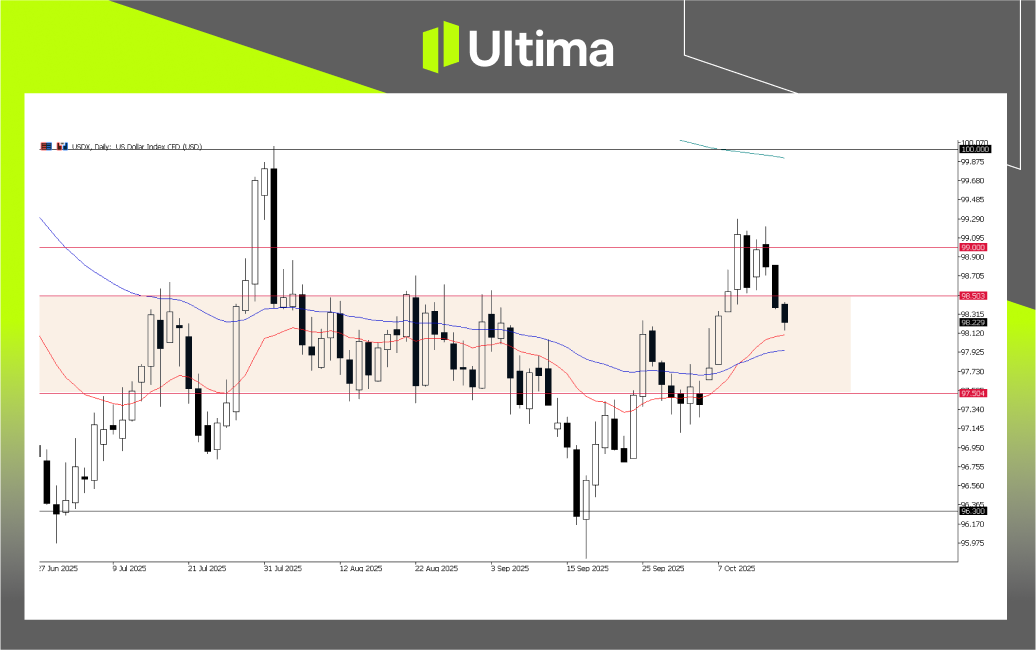
USDX, daily chart | Source: Ultima Markets MT5

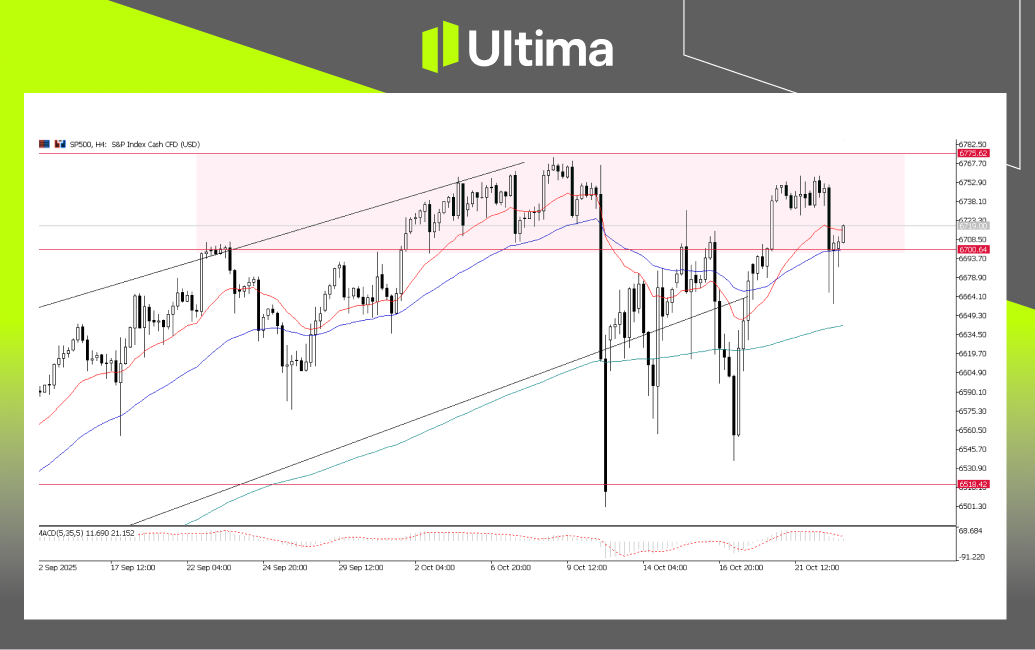
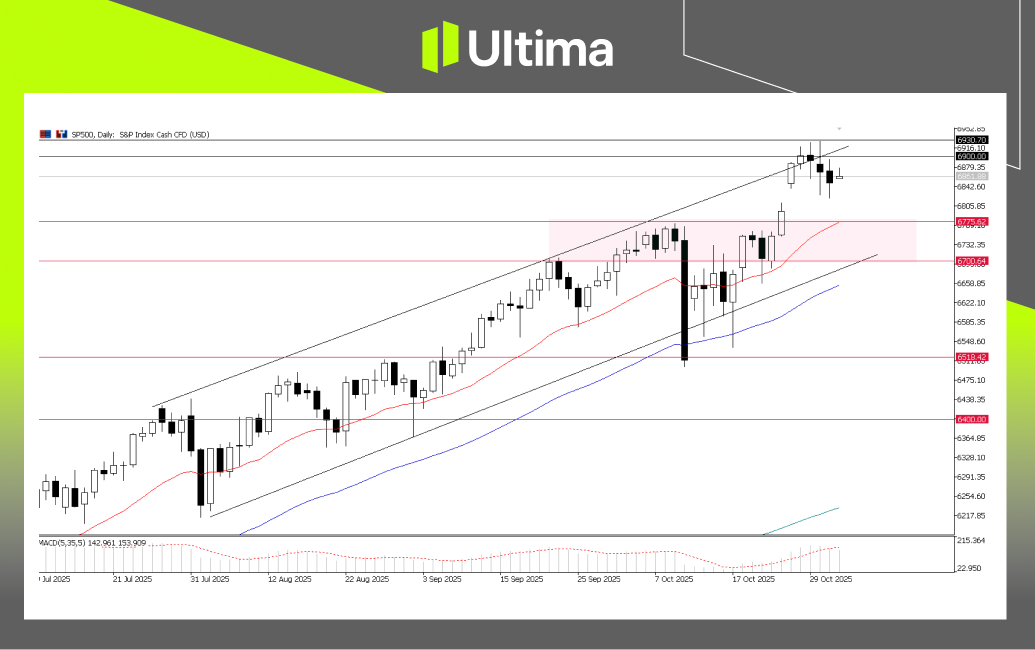
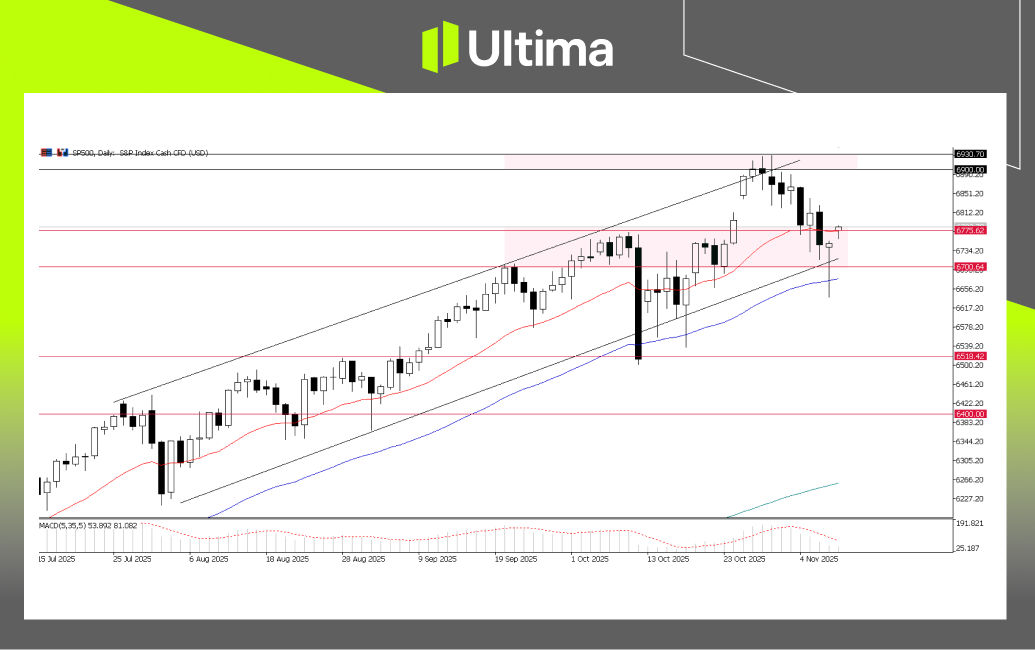
US stocks: Upward momentum capped by trade risks

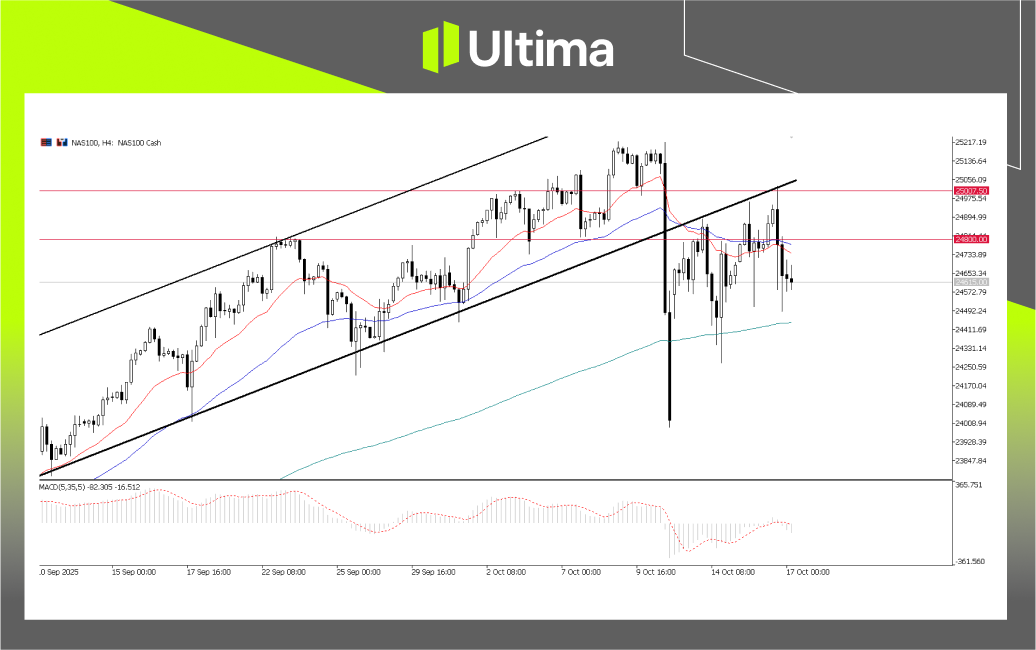
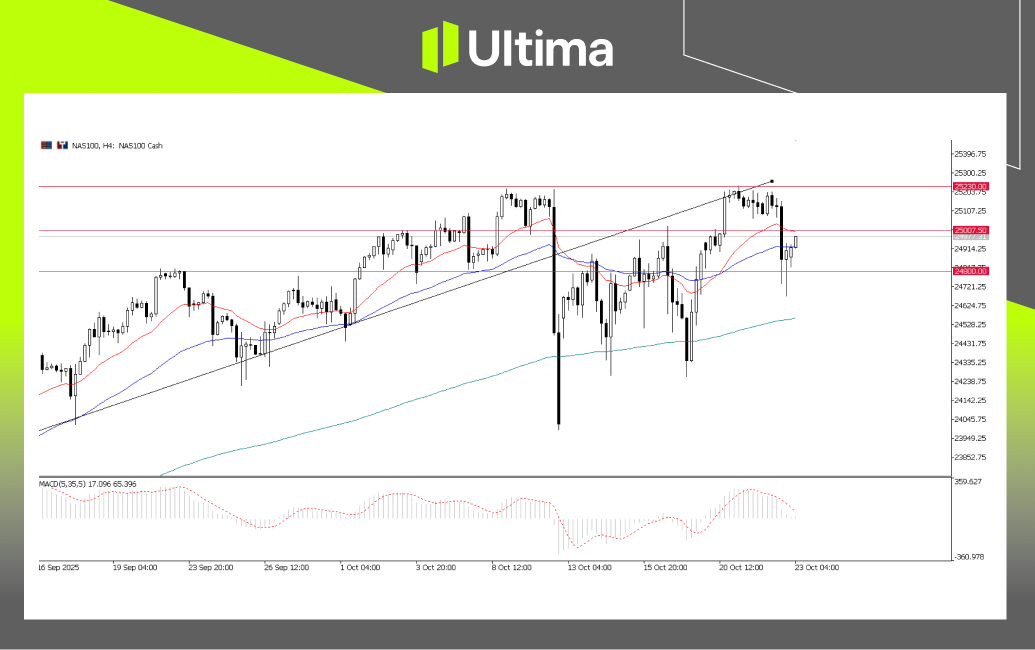
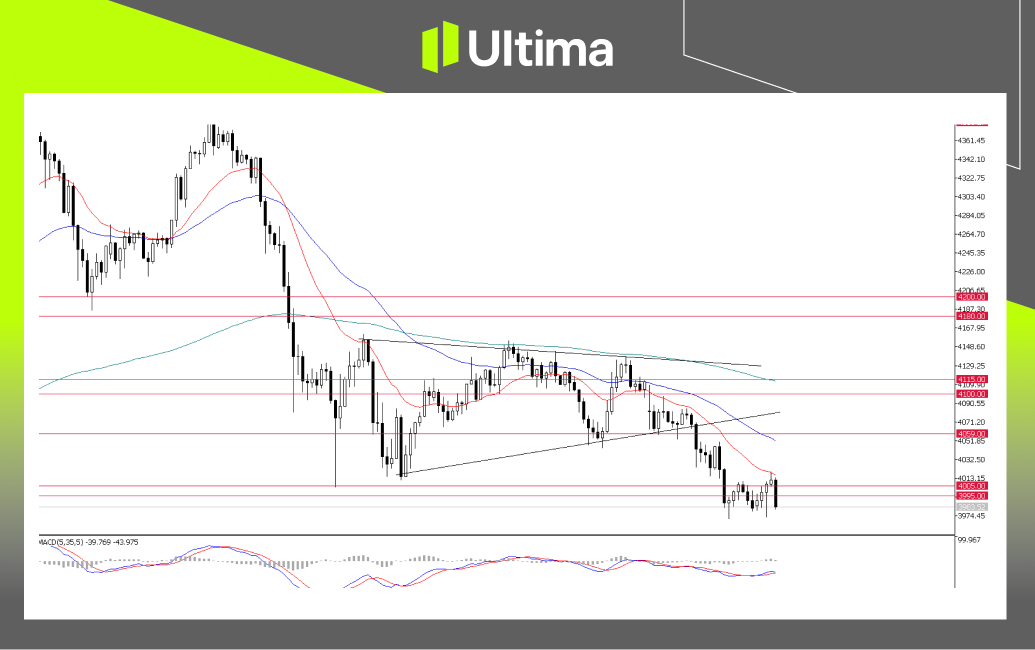
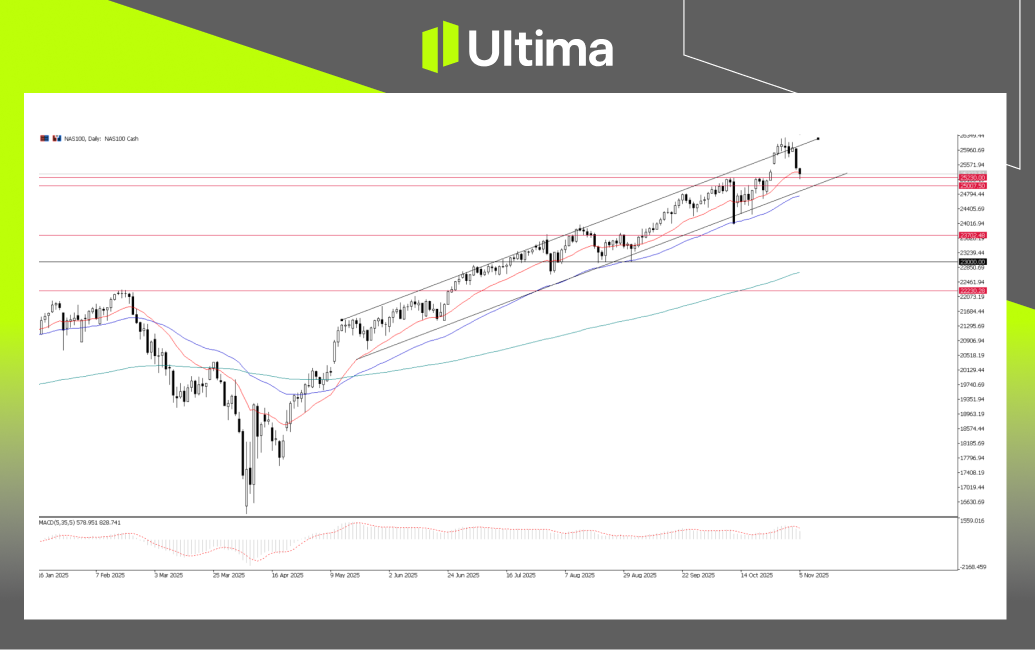
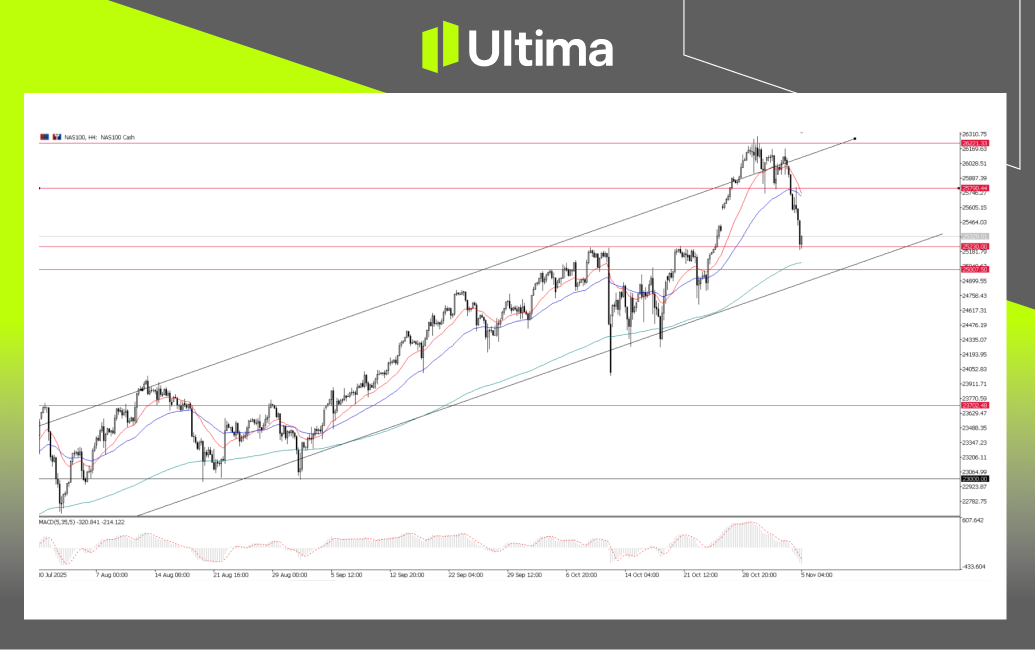
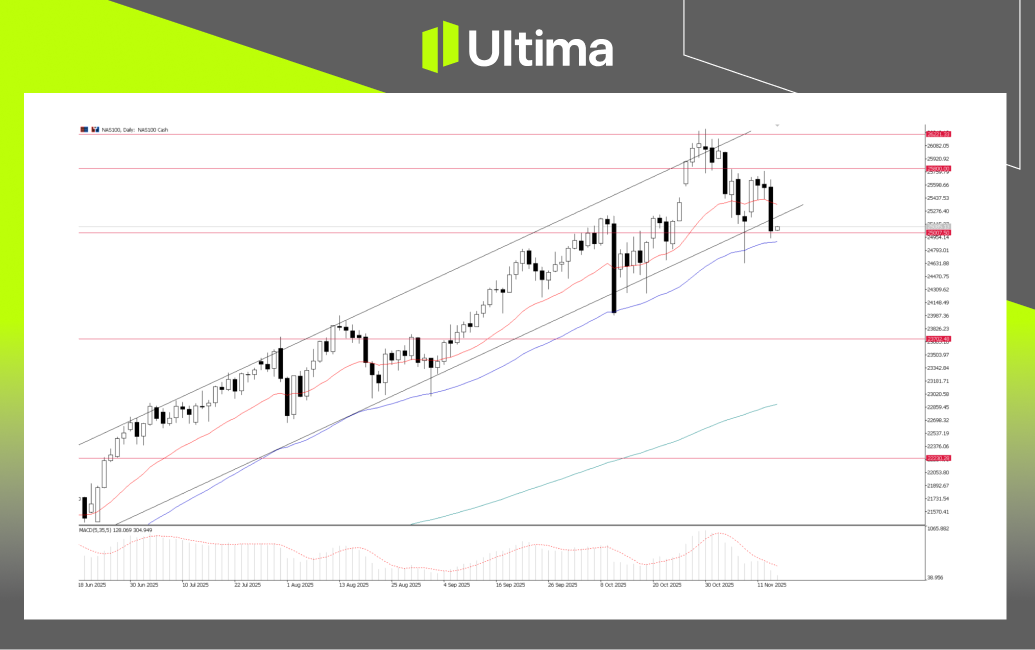
US stocks remain range-bound. While strong earnings reports and easing expectations have provided a brief respite, trade tensions remain a major upward barrier. The Nasdaq 100 Index faces key resistance between 24,800 and 25,000 points . Failure to break through this range could lead to renewed downward pressure.

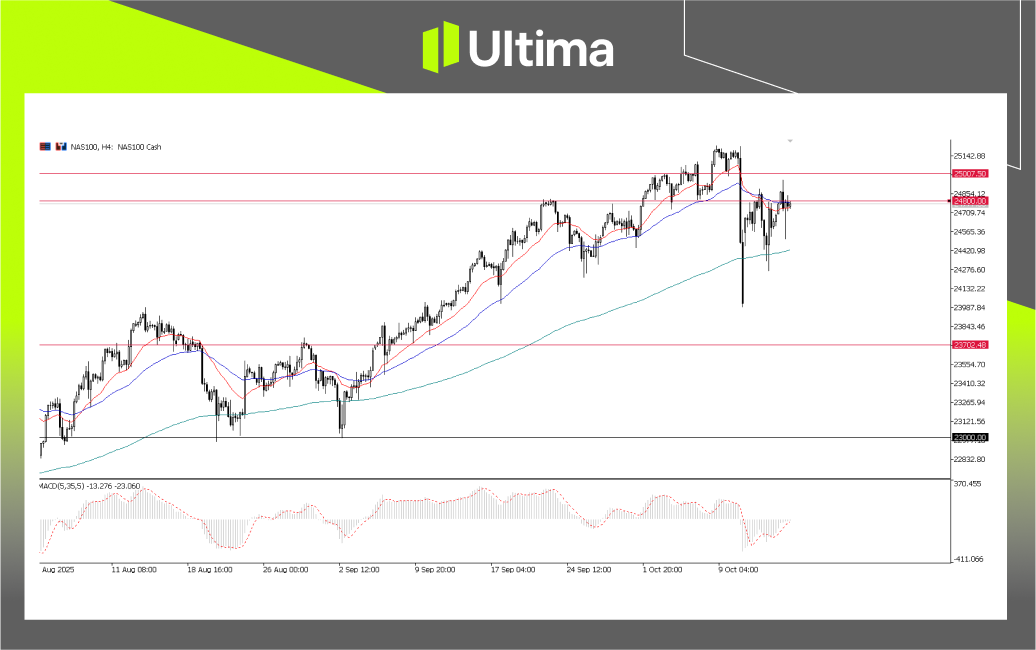
NAS100, 4-hour chart | Source: Ultima Markets MT5

EUR/USD: Swinging between dollar volatility and growth concerns

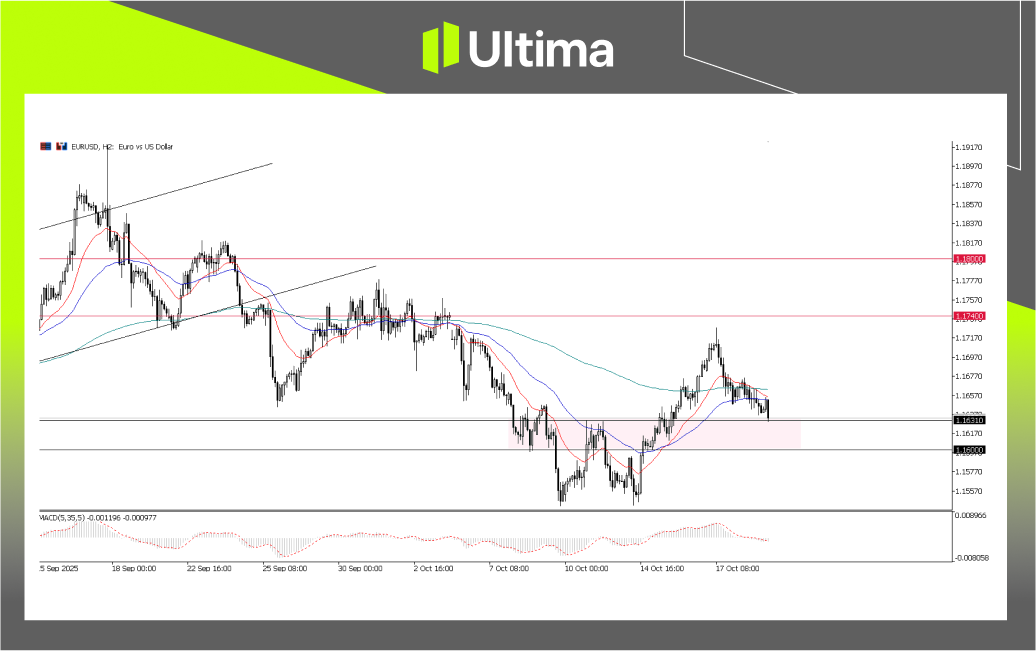
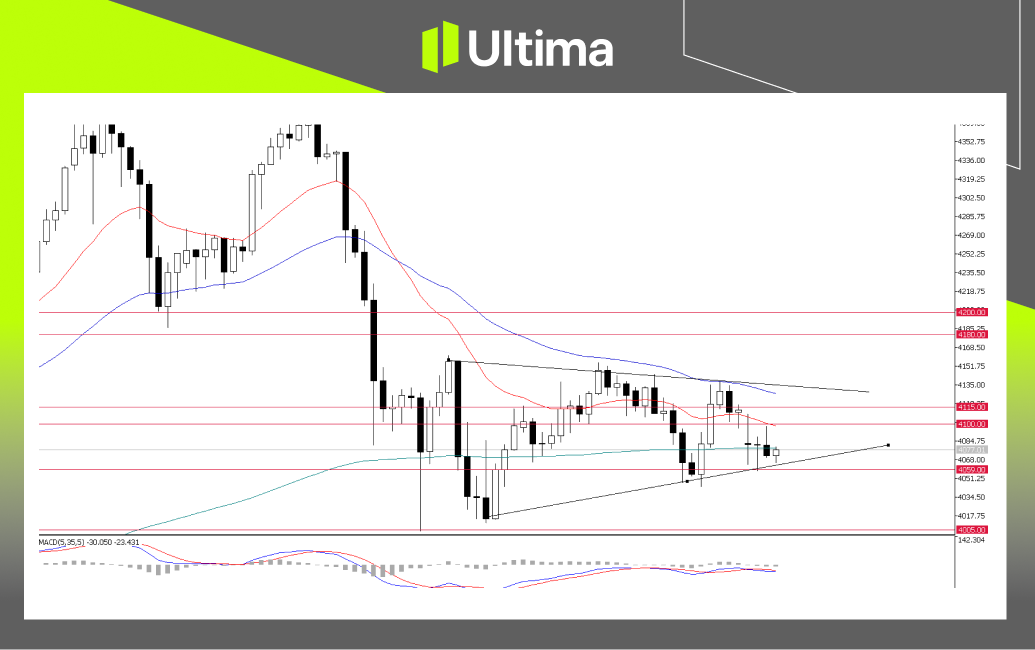
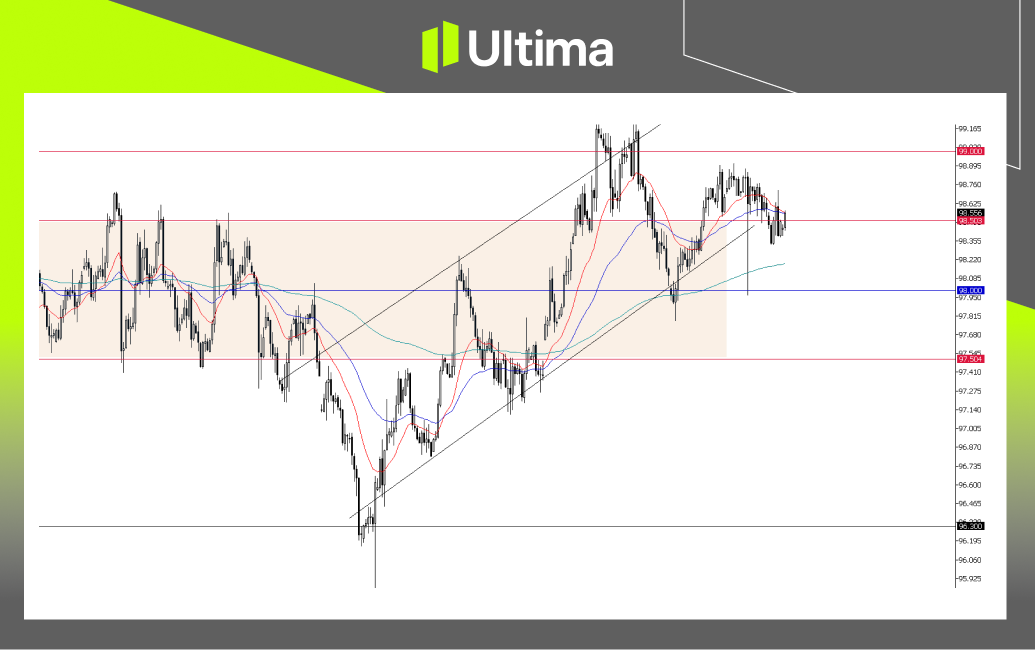
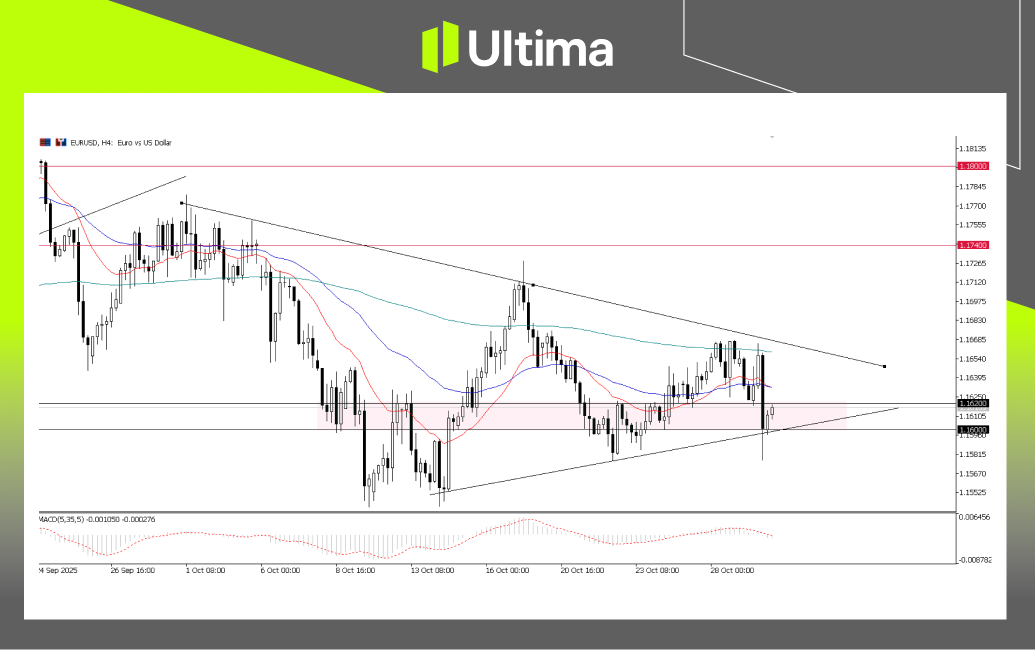
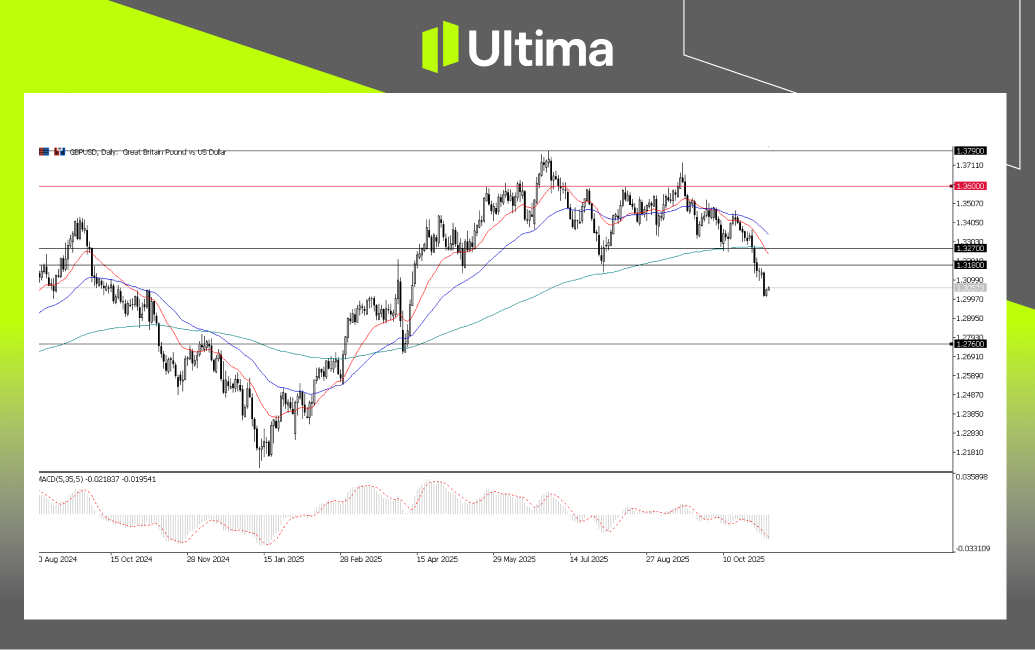
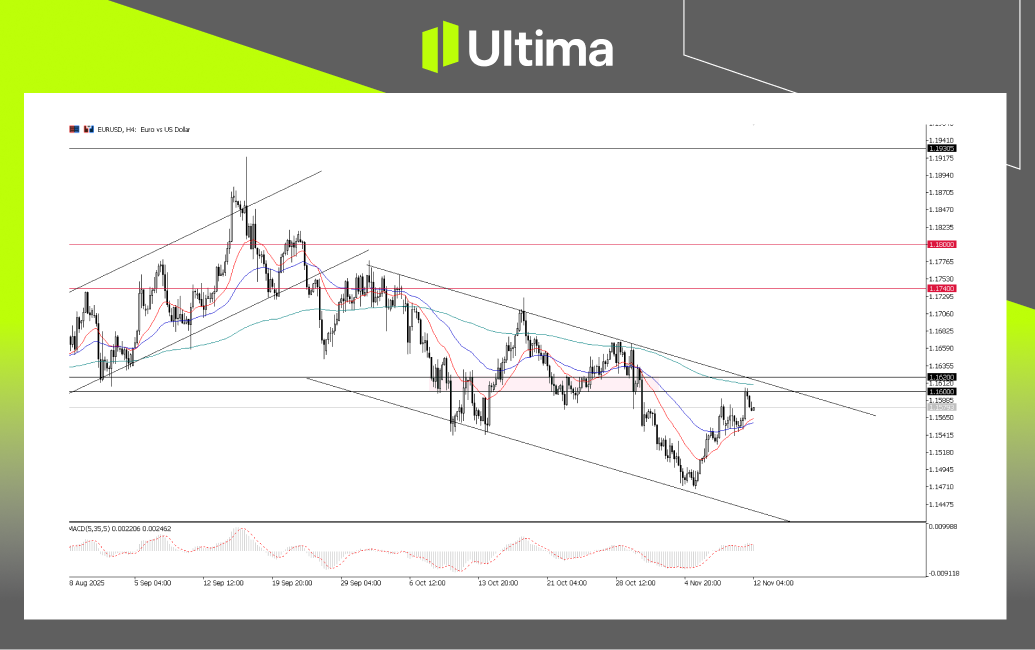
The Euro/USD pair’s performance is primarily influenced by the US dollar’s dynamics. After breaking below the 1.1600 support level, the pair has rebounded, forming a short-term double bottom pattern . A sustained break above the 1.1600–1.1630 range could pave the way for further gains.

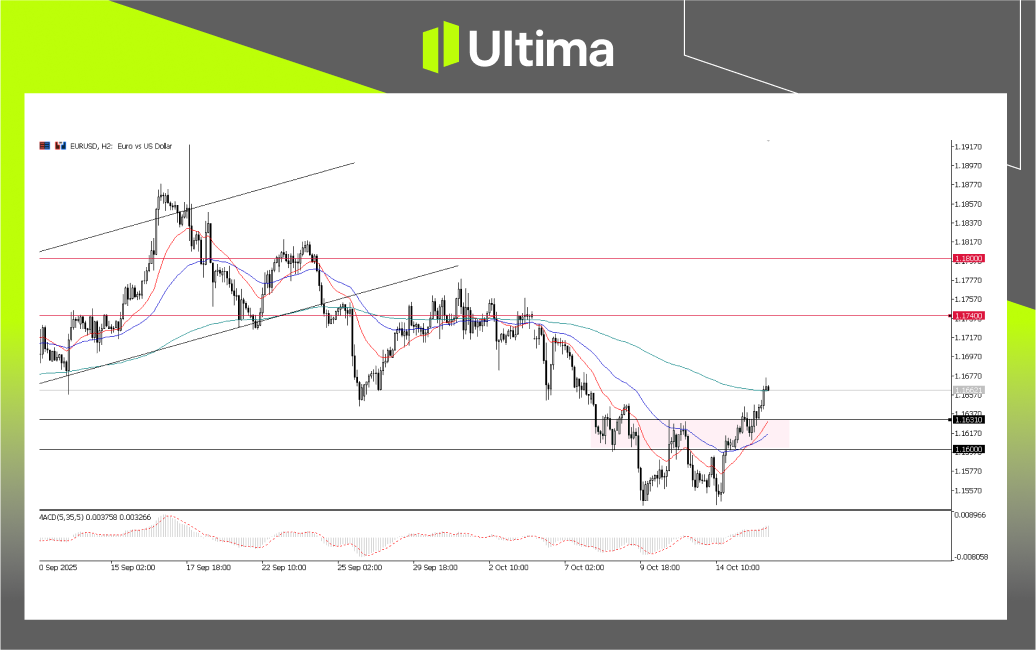
EUR/USD, 2-hour chart | Source: Ultima Market MT5

Risk Warning : Trading leveraged derivatives involves a high level of risk and may result in capital loss.

Disclaimer : The commentary, news, research, analysis, prices, and other information contained herein are for informational purposes only and are intended to assist readers in understanding market conditions. They do not constitute investment advice. Ultima Markets has taken reasonable steps to ensure the accuracy of this information, but its accuracy cannot be guaranteed and is subject to change without notice. Ultima Markets assumes no liability for any loss or damage (including, without limitation, lost profit) arising directly or indirectly from the use of or reliance on such information.
 

Market volatility intensifies amidst a dovish Fed, bank pressures, and trade tensions​

Global markets are facing a new round of uncertainty brought about by the confluence of three major macro forces: a more dovish stance from the Federal Reserve (Fed), renewed pressure on the US banking sector, and ongoing Sino-US trade tensions.

Fed policy and dollar pressure

Federal Reserve Chairman Jerome Powell warned that a sharp slowdown in the U.S. job market is increasing downside risks to the economy, suggesting the central bank could cut interest rates twice more before the end of the year . Several Fed officials reinforced this dovish tone, fueling market expectations for further rate cuts.
  • US dollar technical analysis : The US dollar index (USDX) has fallen back below the key support level of 98.50 . A sustained break below this level will increase the risk of a deeper correction, with the next key support around 97.50 .

USDX, Daily Chart | Source: Ultima Markets MT5

US bank pressure and stock market headwinds

$15 billion from the Federal Reserve’s standing repurchase facility , suggesting increased liquidity pressure in short-term funding markets, triggering new pressure on regional banks.
  • Financials Under Pressure : The financial sector saw heavy selling on Tuesday, dragging down the broader market. Zions Bancorp and Western Alliance Bancorp were among the hardest hit.
  • Stock markets face a correction : While dovish signals and lower yields offer short-term support, weakness in the banking sector and trade uncertainty are curbing upward momentum. If financial stability concerns deepen, stocks could face a correction .

SP500, Daily Chart | Source: Ultima Markets MT5
  • S&P 500 : A recent rebound attempt was rejected near the 6,700 resistance area and a nascent reversal structure may be forming . Failure to reclaim and hold 6,700 could lead to intensified downside pressure.

NAS100, H4 Chart | Source: Ultima Markets MT5
  • Nasdaq 100 (NAS100) : The index is struggling to break through 25,000 points , with the 25,000–24,800 range acting as strong resistance. Failure to reclaim this area could increase downside risks.

Risk Warning : Trading leveraged derivatives involves a high level of risk and may result in capital loss.

Disclaimer : The commentary, news, research, analysis, prices, and other information contained herein are for informational purposes only and are intended to assist readers in understanding market conditions. They do not constitute investment advice. Ultima Markets has taken reasonable steps to ensure the accuracy of this information, but its accuracy cannot be guaranteed and is subject to change without notice. Ultima Markets assumes no liability for any loss or damage (including, without limitation, lost profit) arising directly or indirectly from the use of or reliance on such information.
 

US-China Talks Ahead, Delayed CPI to Drive Market Volatility​

U.S. and global equities extended their rally after last week’s brief pullback, supported by strong technology sector earnings and the Federal Reserve’s (Fed) continued dovish signaling. However, this week’s market focus will center on two key uncertainties: the progress of US-China trade talks and the delayed CPI inflation data.

US-China Trade Tensions

Trade tensions remain the focus of global macro risk. Reciprocal port fees between the two nations are still in place, and the planned 100% tariffs on Chinese imports starting November 1 remain a critical event risk.

Latest developments include:
  • Meetings Scheduled: U.S. and Chinese officials are scheduled to meet next week in Malaysia to seek a de-escalation of trade frictions.
  • High-Level Engagement: Donald Trump has publicly expressed his intention to meet Xi Jinping soon, possibly at the upcoming APEC summit in South Korea.
  • Fragile Outlook: Although Trump hopes for a “fair deal,” he has also threatened tariffs as high as 100%–155%, underscoring the fragile nature of the negotiations.

USD and EUR Technical Outlook

U.S. Dollar: Eyes on 98.50 Resistance

The U.S. Dollar Index (DXY) has rebounded for two consecutive sessions after finding support near the 98.00 level. Technically, the 98.00 support level validates the near-term bullish structure.
  • Key Test: The critical test now lies at 98.50, which acts as immediate resistance.
  • Outlook: A decisive move above 98.50 could reinforce the bullish bias ; however, failure to reclaim it could quickly shift the bias back to the downside.

US Dollar Index, Daily Chart | Source: Ultima Markets MT5

The Euro remains under pressure, weighed down by weak Eurozone growth signals and political instability in France. Technically, EUR/USD’s pullback is retesting the 1.1630–1.1600 support zone. Recent price action formed a short-term double-bottom structure, signaling a potential shift in momentum.
  • Upside Potential: A sustained hold above the 1.1600–1.1630 zone could build short-term upside momentum.
  • Key Resistance: The next target resistance lies between 1.1720–1.1750.
  • Downside Risk: A break below 1.1600 would negate the reversal setup, exposing the Euro to further downside pressure.

EUR/USD, H2 Chart | Source: Ultima Markets MT5

Risk Warning: Trading leveraged derivative products involves high risk and may lead to capital loss.

Disclaimer: Comments, news, research, analysis, price, and all information contained in the article only serve as general information for readers and do not suggest any advice. Ultima Markets has taken reasonable measures to provide up-to-date information, but cannot guarantee accuracy, and may modify without notice. Ultima Markets will not be responsible for any loss incurred due to the application of the information provided.
 

Gold Crashes as Trade Tensions Ease, Yen Pressured by Japan Election​

Daily Markets Insights – 22 October, 2025, Brought to you by Ultima Markets.

Markets opened the session with a slightly improved risk tone, as U.S.–China trade tensions showed early signs of easing:
  • Diplomatic progress: U.S. and Chinese officials confirmed they will meet in Malaysia next week to continue negotiations aimed at avoiding escalation of the tariff dispute.
  • Trump’s tone softens: U.S. President Donald Trump reiterated optimism that “a fair deal can be reached” , even though the 100% tariff threat for November 1 remains on the table.
  • Market response: Investors welcomed the more constructive rhetoric, leading to a mild rebound in equities and reduced safe-haven demand compared to the height of recent tension.
Although optimism is building, the fragility of the talks means market volatility could return quickly if negotiations stall or rhetoric hardens again.

Gold & Silver: Rally Reversed at Resistance

Gold prices plunged sharply on Tuesday, marking their largest single-day loss since 2013, after reaching record highs earlier last week. The precious metal fell more than 6% , as a wave of profit-taking and easing geopolitical fears triggered heavy liquidation across the market.

Several key factors contributed to the selloff:
  • Eased Safe-haven demand: Optimism over a potential de-escalation in U.S.–China trade tensions, and improved global risk appetite, reduced gold’s appeal as a hedge.
  • Massive profit-taking: After weeks of continuous gains, many investors chose to realize profits, leading to a concentrated release of selling pressure.
  • Stronger U.S. dollar: The U.S. Dollar Index rebounded, adding further downside pressure to gold prices, making dollar-denominated gold less attractive to overseas buyers.

XAU/USD, 2-Hour Chart|Source: Ultima Markets MT5

Technically, gold broke below the $4,200 support after forming a double-top pattern, basically signaling that gold is undergoing a short-term bearish move.
  • Now traders will keep an eye on the key level of $4,000 to see if it can hold as a short-term pivot support.
  • If this level holds, it could indicate that gold may enter a period of corrective move in a consolidation form for now.

XAGUSD, H2 Chart | Source: Ultima Markets MT5

Silver (XAGUSD) also followed gold’s price action, undergoing a sharp pullback after an impressive rally.
  • Technically, silver has shown a clear bearish reversal signal on the 2-hour chart, with a head and shoulders pattern formed.
  • With silver now breaking below the $50.80 neckline support, this suggests that the near-term trend has shifted into a bearish phase.

Japan Political Progress Keeps Yen Under Pressure

The yen remains soft as political developments in Japan continue to shape market sentiment. The recent leadership victory of Sanae Takaichi — Japan’s first female Prime Minister — has shifted expectations toward more aggressive fiscal stimulus, which may delay any further tightening from the Bank of Japan (BoJ).


USD/JPY, Daily Chart|Source: Ultima Markets MT5

The pair continues to trade above the 150 level, keeping upside momentum intact. As long as USD/JPY holds above 150, the bullish bias remains in place. Easing U.S.–China tensions have reduced safe-haven demand for the yen, while Japan’s domestic political backdrop is adding further downside pressure on the currency.

Risk Warning: Trading leveraged derivative products involves high risk and may lead to capital loss.

Disclaimer: Comments, news, research, analysis, price, and all information contained in the article only serve as general information for readers and do not suggest any advice. Ultima Markets has taken reasonable measures to provide up-to-date information, but cannot guarantee accuracy, and may modify without notice. Ultima Markets will not be responsible for any loss incurred due to the application of the information provided.
 

Trade Uncertainty and Tech Earnings Weigh on U.S. Equities​

U.S. stock indices ended lower on Wednesday, failing to sustain recent gains , driven by the resurgence of trade tension and a mixed start to Big Tech earnings.

Market sentiment turned cautious following reports that the Trump administration is considering expanded restrictions on “software-enabled exports” to China , seen as a direct counter-measure to Beijing’s rare-earth export controls. Although President Trump maintains an optimistic stance, saying he “thinks we’ll make a deal” with Xi Jinping , market wariness of renewed escalation remains high. The disappointment, highlighted by Netflix’s stock plunging nearly 10% after its latest results , combined with the renewed macro risk from China, is pressuring the tech and growth sectors.

U.S. Equities Technical Outlook

  • Nasdaq 100 (NAS100): Is now facing resistance near its previous record high of 25,230. Technically, the NAS100 may be forming a “double-top“ pattern, which could signal a potential downside reversal. Traders should watch whether the price remains pressured below the 25,000–24,800 zone—a failure to reclaim this area could confirm a near-term bearish shift.

NAS100, H4 Chart | Source: Ultima Market MT5

  • S&P 500 (S&P 500): The key support level remains 6,700. A break below this zone could bring renewed downside pressure; however, a sustained move above it would help maintain the current bullish structure.

SP500, H4 Chart | Source: Ultima Market MT5

Daily Market Outlook: U.S. Equities

While U.S. equities have shown overall resilience, the combination of renewed trade uncertainty and a mixed earnings outlook is beginning to cloud the upside momentum. The market’s next directional cues will likely hinge on next week’s high-level U.S.–China trade talks in Malaysia and the upcoming Trump–Xi meeting at the APEC summit in South Korea. Any meaningful progress could restore confidence; a breakdown in negotiations may trigger a deeper corrective move across equities.

Risk Warning: Trading leveraged derivative products involves high risk and may lead to capital loss.

Disclaimer: Comments, news, research, analysis, price, and all information contained in the article only serve as general information for readers and do not suggest any advice.
 

Trade progress and Fed easing expectations boost global markets​

The US-China trade framework boosted risk sentiment, with the market focused on the Federal Reserve meeting and CPI data. The US dollar fluctuated around 98.50, and gold came under pressure to test the 4000 mark.

Last weekend, the market’s biggest downside risk—US-China trade tensions—significantly eased, driving a strong rebound in global multi-asset risk sentiment. US Treasury Secretary Scott Bessant announced that the two sides had reached “a very substantial framework agreement” during high-level talks in Malaysia. The framework is expected to prevent the US from imposing 100% tariffs on Chinese goods and may postpone China’s rare earth export controls. This move is intended to pave the way for Presidents Trump and Xi Jinping to finalize a trade agreement at the APEC summit in South Korea this week.

This positive development triggered a strong wave of risk appetite in global markets :
  • Stock market : Major Asian stock indices rose sharply today (Japan and South Korea rose by about 2%), and S&P 500 and Nasdaq futures continued to rise.
  • Commodities : Assets representing global demand, such as crude oil and copper, saw significant increases.
  • Safe-haven assets : Gold and U.S. Treasuries fell as demand for safe-haven assets declined.
The delayed US CPI data released last Friday showed that the core CPI (monthly rate) was lower than market expectations, further reinforcing market expectations of a dovish stance from the Federal Reserve. The market has now fully priced in a 25 basis point rate cut at the FOMC meeting this Wednesday.

USDX, 2-hour chart | Source: Ultima Markets MT5

Last week’s CPI data was lower than expected, triggering a short-term decline in the US dollar, but it subsequently rebounded at the 98.00 support level and is currently maintaining above 98.50 .
  • From a macro perspective, market expectations of a dovish Federal Reserve policy this week may continue to suppress the US dollar.
  • If the 98.50 support is broken, the US dollar may face downside risks.

Gold Outlook: Safe-haven demand plummets, putting pressure on the 4,000 mark

News of a “substantive framework agreement” between the US and China has significantly reduced geopolitical risk premiums, accelerating profit-taking and exerting significant downward pressure on gold. Following a historic rally, gold is now entering a clear correction.
  • The current key psychological level is still at $4,000 : if the 4,000 support holds, the short-term may enter a phase of volatile consolidation; if 4,000 is lost, it will open up further room for decline.
  • $4,000 remains the key battlefield for short-selling profits and long-selling support.

XAU/USD, 2-hour chart | Source: Ultima Markets MT5


Risk Warning : Trading leveraged derivatives involves a high level of risk and may result in capital loss.

Disclaimer : The commentary, news, research, analysis, prices, and other information contained herein are for informational purposes only and are intended to assist readers in understanding market conditions. They do not constitute investment advice. Ultima Markets has taken reasonable steps to ensure the accuracy of this information, but its accuracy cannot be guaranteed and is subject to change without notice. Ultima Markets assumes no liability for any loss or damage (including, without limitation, lost profit) arising directly or indirectly from the use of or reliance on such information.
 

Markets focus on the Fed’s decision, supported by trade optimism​

Market activity was relatively quiet on Tuesday, as investors awaited the Federal Reserve’s (Fed) interest rate decision tomorrow, October 29th. Following last Friday’s weaker-than-expected core CPI reading, the market has fully priced in a 25 basis point rate cut. Consequently, market focus has shifted entirely to the wording and forward guidance of the Fed’s statement.

US dollar: Dovish sentiment already priced in

The US dollar remains under pressure as the market prices in a potentially dovish stance from the Federal Reserve. The US Dollar Index (USDX) has now fallen below the 98.50 support level. A clear break below this level would likely send the dollar lower, particularly if the Fed’s tone is more dovish than expected.

USDX, 2-hour chart analysis | Source: Ultima Markets MT5

The Outlook for Sino-US Trade and Trump’s Asia Trip

The market backdrop this week was dominated by a major diplomatic breakthrough in US-China trade relations.
  • Tariff threat lifted : China and the United States have reached “a very substantive framework agreement,” and the threat of 100% tariffs on Chinese imports originally scheduled for November 1 has now been “essentially eliminated.”
  • Rare Earth Export Delay : China agreed to delay or postpone the expansion of export controls on rare earth minerals for about a year, helping to ease supply chain concerns.
  • High-level meeting : The framework is intended to lay the groundwork for a meeting between Presidents Trump and Xi Jinping at the APEC summit later this week , where a comprehensive agreement is expected to be formalized.

Gold: Corrective trend continues, $4,000 mark under pressure

after Monday’s sharp drop below $4,000 , with trade optimism being its biggest headwind.
  • Technical analysis : Gold fell below the converging triangle pattern yesterday, showing that bearish momentum remains strong.
  • Key Level : Although gold prices are hovering around the $4,000 mark, it may continue to fluctuate below this level before the Fed decision.

XAU/USD, 4-hour chart | Source: Ultima Markets MT5


Risk Warning : Trading leveraged derivatives involves a high level of risk and may result in capital loss.

Disclaimer : The comments, news, research, analysis, prices and other information contained in this article are for reference only and are intended to help readers understand the market situation and do not constitute investment advice.
 

FOMC Decision Preview: The Tone Will Be Everything​

Market sentiment is tense ahead of the Federal Reserve’s (Fed) policy announcement later today. Following yesterday’s strong rally in equities, traders are braced for sharp moves depending on how Chair Jerome Powell frames the path forward.

The Fed is widely expected to deliver its second rate cut of the year, reducing the federal funds rate by 25 basis points to 3.75%–4.00%. Since this move is already fully priced in by the market, the key driver for reaction will be Powell’s tone and forward guidance, not the rate cut itself.

The Fed faces a delicate balancing act: a softening labor market supports further easing, while persistent inflation (partly fueled by tariffs) calls for caution.

Key investor questions include:
  • Will Powell validate market pricing for another cut in December?
  • Will he hint at an earlier end to Quantitative Tightening (QT)?

Market Scenarios to Watch

  • Dovish Surprise (Bullish for Stocks/Gold): Powell is more explicit about future cuts, confirms concern over employment risks, and hints at ending QT sooner. This “soft landing plus liquidity” scenario would cause the USD to plunge and risk assets to surge.
  • Hawkish Surprise (Bearish for Stocks/Gold): Powell is overly cautious, arguing that inflation remains above target and that the Fed must “wait and see” before committing to December. This signals a policy pause and would cause a sharp sell-off in equities and a strong rally in the U.S. Dollar.

U.S. Dollar Index: Coiled for Policy Break

The U.S. Dollar Index (DXY) is exhibiting cautious movement, currently trading near the 98.50–98.70 range. The 98.50–99.00 zone remains the key overhead resistance.
  • Downside: A decisive break below 98.50, particularly triggered by a dovish surprise, would confirm a resumption of the broader downtrend, potentially driving the index lower toward 97.50.
  • Limited Downside Risk: If Powell’s dovish tone remains within expectations, the downside pressure on the USD may be limited, as markets have already priced in another potential rate cut in December.

USDX, H4 Chart | Source: Ultima Market MT5

U.S. Stock Outlook: Record Highs on a Tightrope

U.S. stock indices continue to hover near record highs. Optimism is supported by the expectation that a rate cut will signal a return to a more accommodative environment, where lower borrowing costs fuel further equity expansion.
  • Key Dependency: The market’s current trajectory is highly dependent on the Fed’s tone. A hawkish surprise from Powell could trigger a deeper short-term pullback in the S&P 500 and across major benchmarks.
  • Broader Trend: While a hawkish Fed may prompt a corrective sell-off or profit-taking phase, the underlying momentum driven by solid fundamentals is unlikely to derail the broader bullish trajectory of the equity market.

SP500, Daily Chart | Ultima Market MT5


Risk Warning: Trading leveraged derivative products involves high risk and may lead to capital loss.

Disclaimer: Comments, news, research, analysis, price, and all information contained in the article only serve as general information for readers and do not suggest any advice.
 

A Review of the Fed’s “Hawkish Rate Cut”: Powell Changed Market Expectations​

The US dollar rebounded strongly after the Fed’s hawkish rate cut, and the market is focused on whether the policy divergence between the ECB and the Bank of Japan can sustain the dollar’s upward trend; key levels to watch are DXY 99.00 and USD/JPY 153.

As expected, the Federal Reserve (Fed) cut interest rates by 25 basis points for the second consecutive time at its October meeting . However, Chairman Jerome Powell’s cautious remarks at the press conference completely changed the market’s view on the future easing cycle.
  • Key turning point : Powell made it clear that whether there will be another rate cut in December is “far from certain,” and emphasized that future policy will depend entirely on economic data performance.
  • Market reaction : The Fed’s cautious tone quickly dampened market expectations for further easing. According to the CME FedWatch tool, the probability of a December rate cut plummeted from nearly 90% to just 32% . The dollar surged as a result, while stocks and gold both declined.

Focus: ECB and BOJ policy decisions

The focus of global monetary policy has now shifted to Japan and the Eurozone, where the contrast with the Federal Reserve’s “cautiously hawkish” stance will become a major source of volatility.
  • The Bank of Japan (BoJ) widely expects the interest rate to remain unchanged at 0.5% . The widening interest rate differential between the US and Japan, coupled with the Federal Reserve’s shift towards a hawkish stance, will continue to support the US dollar against the Japanese yen (USD/JPY).
  • The European Central Bank (ECB) is expected to maintain its main interest rates unchanged and retain a neutral, data-dependent stance. This will further suppress the euro/dollar exchange rate compared to the Federal Reserve’s hawkish rate cut.

Technical Outlook: US Dollar vs. Japanese Yen and Euro

  • The US Dollar Index (USDX) rebounded strongly after the Fed meeting, maintaining its overall bullish structure. If policy divergences continue to widen, the dollar is expected to continue challenging the key resistance level of 99.00 .

USDX, H4 Chart | Source: Ultima Market MT5
  • USD/JPY : Surges after the FOMC decision, approaching a multi-month high of 153.00 . If the Bank of Japan holds rates steady, the upward momentum for USD/JPY is likely to continue.

USD/JPY, H4 Chart | Source: Ultima Market MT5
  • Euro/USD : The pair fell sharply after the meeting, briefly breaking below the key support level of 1.1600 . A break below 1.1600 would open the way for a move towards 1.1550 if the ECB releases dovish signals .

EURUSD, H4 Chart | Source: Ultima Market MT5


Risk Warning : Trading leveraged derivatives involves high risk and may result in capital loss.

Disclaimer : The comments, news, research, analysis, prices and other information contained in this article are for reference only and are intended to help readers understand the market situation and do not constitute investment advice.
 

Global Diplomatic Breakthrough: US and China Reach One-Year Trade Truce​

The US and China reached a trade truce, and the Bank of Japan and the European Central Bank diverged in policy, jointly driving the US dollar higher. Risk sentiment improved, but policy divergence remains a key factor dominating the market.

The meeting between US President Donald Trump and Chinese President Xi Jinping during the APEC summit achieved a major breakthrough, with both sides agreeing to suspend the tariff war for 12 months and postpone all new trade measures. Most importantly, the threat of imposing 100% tariffs on Chinese imports, originally scheduled for November 1st, has been “fundamentally eliminated.” In return, China pledged to resume large-scale purchases of US agricultural products.

The trade truce significantly boosted global risk appetite, and markets quickly recovered from intraday losses caused by Meta earnings reports and the Federal Reserve’s hawkish tone.

Central Bank Decision: Policy Divergence Continues to Widen

Yesterday’s meeting between the Bank of Japan (BoJ) and the European Central Bank (ECB) highlighted the deepening divergence in global monetary policy, a trend that continues to support a stronger dollar while putting downward pressure on the yen and the euro.
  • The Bank of Japan (BoJ) maintained its interest rate at 0.5% , as expected . While Governor Kazuo Ueda maintained a cautiously hawkish tone, his prudent wording dampened market expectations for short-term action. The widening interest rate differential between the US and Japan pushed the yen to its lowest level against major currencies since February.
  • The European Central Bank (ECB) kept its main interest rates unchanged, maintaining a neutral tone . ECB President Christine Lagarde warned that the growth outlook remains “fraught with uncertainty” and reiterated its “data-dependent, meeting-by-meeting” strategy, which failed to provide support for the euro.

The US dollar dominates the market, approaching 100.00.

The Federal Reserve’s cautious hawkish stance, the Bank of Japan’s conservative position, and the European Central Bank’s wait-and-see attitude have collectively led to the dollar regaining its dominant position.
  • The US Dollar Index (DXY) broke strongly above the 99.00 level, reaching a multi-month high and confirming a short-term upward trend. Technically, the dollar is currently holding steady above 99.00 , with momentum leaning towards a further test of the 100.00 level.

USDX, H4 Chart | Source: Ultima Markets MT5
  • Foreign Exchange Outlook : Policy divergences will help the US dollar continue to strengthen in the short term.

Risk Warning : Trading leveraged derivatives involves high risk and may result in capital loss.

Disclaimer : The comments, news, research, analysis, prices, and other information contained herein are for informational purposes only and are intended to help readers understand market conditions. They do not constitute investment advice. Ultima Markets has taken reasonable steps to ensure the accuracy of the information, but cannot guarantee its absolute accuracy and it is subject to change at any time without notice. Ultima Markets shall not be liable for any loss or damage (including, but not limited to, loss of profits) that may result from the direct or indirect use of or reliance on such information.
 

US-China Trade Truce Boosts Risk Appetite: Market Outlook and USD/US Stock Analysis, November 3, 2025​

The new week started with strong risk-on sentiment, primarily driven by the US-China trade truce and robust earnings from tech stocks. However, the US government shutdown has entered its 34th day, nearing a record high, and the interruption of key economic data releases casts a shadow over whether the non-farm payroll (NFP) report will be released on schedule, becoming the focus of the market this week.

Macro Theme: Trade Truce vs. US Government Shutdown Risk

The core driver of the current market rebound stems from the one-year tariff truce agreement reached between US President Trump and Chinese President Xi Jinping, which included an agreement to ease restrictions on rare earth exports. This geopolitical easing measure significantly reduces tail risks to global growth.

Positive Effects of the Trade Truce:
  • Eliminating the threat of escalating tariffs boosts global risk appetite.
  • Funds accelerate their inflow into cyclical assets and emerging markets.
  • Industrial activity is expected to stabilize after the easing of trade tensions.
Market Caution Signals:

Despite heightened optimism, the rally is primarily driven by a few large-cap tech stocks, lacking broad market breadth. A disappointing earnings report from these leading stocks could trigger a sharp pullback.

Meanwhile, the US government shutdown has halted the release of official data (such as GDP, retail sales, and non-farm payrolls), forcing the market to rely on private sector surveys to assess economic health. This exacerbates economic data uncertainty and moderately weighs on growth expectations, indirectly reinforcing the Fed’s stance of needing accommodative policy to address non-monetary risks.

Key Data Today: ISM Manufacturing PMI

Due to the lack of official statistics during the government shutdown, the ISM Manufacturing PMI is the most closely watched private sector indicator today. The market expects this data to show signs of stabilizing industrial activity against the backdrop of a trade truce, providing significant guidance for the dollar’s movement and the direction of US stocks.

US Dollar Index (USDX) Analysis: Breaking the 99 Mark, Approaching the 100 Mark

The US dollar continues its upward trend since mid-October, breaking through the 99 mark and currently trading around 99.60, supported by expectations of a hawkish rate cut by the Fed and policy divergence between the BoJ and ECB. USDX, H4 Chart | Source: Ultima Market MT5

Technical Analysis Highlights:
  • Key Resistance Zone: 100.00–100.30 A valid breakout on the daily chart would confirm a medium- to long-term bullish reversal.
  • Short-term Support: 99.25, 99.00 As long as it holds above 99, the short-term bullish structure for the US dollar remains intact.
  • US Dollar Outlook: Strong upward momentum, but if the economic data vacuum continues, the 100 level may become a short-term ceiling.

US Stock Analysis: S&P 500 Encounters Resistance at High Levels, Short-Term Correction Risk Increases

Both the Nasdaq and S&P 500 indices hit record highs last week, but technical indicators show signs of upward momentum weakening, increasing short-term risks.

S&P 500, Daily Chart | Source: Ultima Market MT5

Key Levels for the S&P 500:
  • Current Price: Consolidating around 6900
  • Resistance Hub: 6900–6930 (Horizontal Resistance + Upper Edge of Mid-Term Channel)
  • Support Level: 6775 (Bull Structure Defense Line)
Trend Forecast:
  • Breakout above 6900 → Confirms continuation of the uptrend
  • Retreat after resistance → Possible healthy pullback to the 6775 area
  • Currently, consolidation at higher levels is more likely than a trend reversal.

Daily Market Outlook Summary: Risk appetite rises, but vulnerability intensifies

The US-China trade truce continues to boost market sentiment, but the economic data disruption caused by the US government shutdown is becoming a concern for growth. While the US dollar and US stocks remain strong, technical signs of weakness are emerging, and short-term movements are highly dependent on:
  • Today’s ISM Manufacturing PMI performance
  • Whether the government shutdown is nearing resolution
  • Whether this week’s non-farm payroll report will be released
Investors should be wary of the risk of a pullback from these high levels and are advised to closely monitor the key technical levels of 6,900 (US stocks) and 100 (US dollar).

Disclaimer

The comments, news, research, analysis, prices, and other information contained in this article are for informational purposes only and are intended to help readers understand market conditions. They do not constitute investment advice. Ultima Markets has taken reasonable steps to ensure the accuracy of the information but cannot guarantee its absolute accuracy and it is subject to change without notice. Ultima Markets is not liable for any loss or damage (including but not limited to loss of profits) that may result from the direct or indirect use of or reliance on such information.
 
Back
Top