Daily Market Analysis By FXOpen

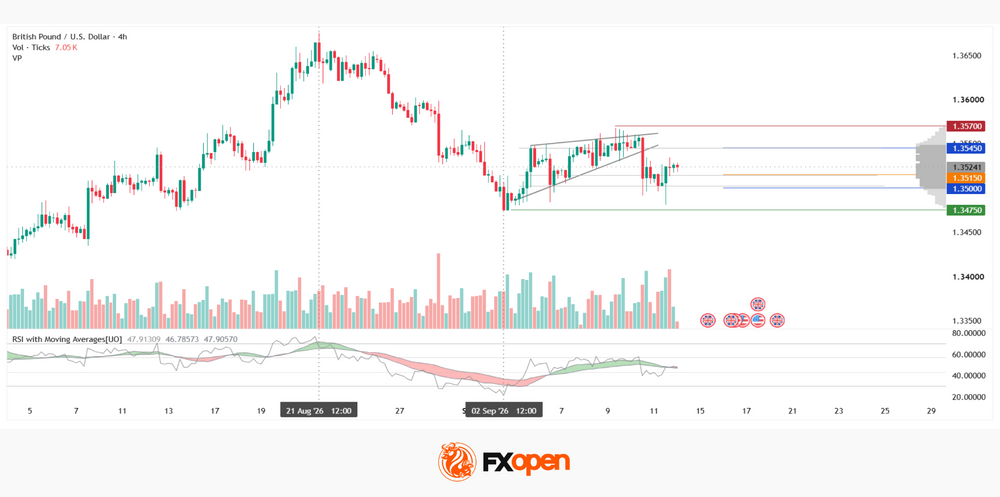
GBP/USD Analysis: Wedge Breakout Attempt Ahead of Fed and BoE Decisions

gbpusd.jpg


The foreign exchange market is heading into a busy week, with the Federal Reserve meeting on 15–16 September, followed by the Bank of England’s rate decision on 17 September. This sequence of central bank meetings, rather than individual macroeconomic releases, is shaping the current fundamental backdrop for the pound. Ahead of the decisions from the two major central banks, market participants are likely to remain cautious as they assess the future direction of monetary policy in the US and UK.
gbpusd.png


TO VIEW THE FULL ANALYSIS, VISIT FXOPEN BLOG

Disclaimer: This article represents the opinion of the Companies operating under the FXOpen brand only (excluding FXOpen EU). It is not to be construed as an offer, solicitation, or recommendation with respect to products and services provided by the Companies operating under the FXOpen brand, nor is it to be considered financial advice.

 
EUR/USD: A Broken Trendline Meets the Fed's Biggest Test Yet
eurusd.jpg


EUR/USD sits near 1.1610, just off a one-month low, as tomorrow's Fed decision looms as the week's true catalyst. The ECB delivered its second hike of the year on September 10, lifting the deposit rate to 2.50% and warning that Middle East-driven inflation pressures will keep price growth well above target for an extended period. Lagarde called the move a "no-brainer", yet the euro barely reacted; the hike had been fully priced in, and markets are already pricing more ECB tightening than the central bank's own projections suggest is needed.

The real action lies across the Atlantic. Thursday's hotter-than-expected US CPI print pushed September Fed hike odds sharply higher, from 67% to 88% intraday, though the dollar has struggled to fully capitalise as falling oil prices pull Treasury yields back from three-year highs near 4.99%. Adding political noise, President Trump has reportedly pressed Fed Chair Kevin Warsh directly on rate cuts, a claim Trump himself has downplayed, just as the Fed enters its blackout period ahead of Tuesday's meeting.

The result: an ECB that has already delivered its hawkish surprise with muted market impact, against a Fed whose next move, and its independence from political pressure, could prove far more consequential for EUR/USD heading into Wednesday.
eurusd.png


TO VIEW THE FULL ANALYSIS, VISIT FXOPEN BLOG

Disclaimer: This article represents the opinion of the Companies operating under the FXOpen brand only (excluding FXOpen EU). It is not to be construed as an offer, solicitation, or recommendation with respect to products and services provided by the Companies operating under the FXOpen brand, nor is it to be considered financial advice.

 
How to Use the Opening Range Breakout (ORB) Strategy in Trading


In this video, we'll explore the Opening Range Breakout (ORB) strategy in depth.
  • The Opening Range Breakout Strategy Explained
  • Using the ORB for Stocks and Forex
  • Breakout Strategy
  • Pullback Strategy

Watch it now and stay updated with FXOpen.

TO VIEW THE FULL ANALYSIS, VISIT FXOPEN YOUTUBE

Disclaimer: This article represents the opinion of the Companies operating under the FXOpen brand only (excluding FXOpen EU). It is not to be construed as an offer, solicitation, or recommendation with respect to products and services provided by the Companies operating under the FXOpen brand, nor is it to be considered financial advice.

 
Smart Money Concept and How To Use It in Trading | SMC Explained


Unlock the secrets of trading with the Smart Money Concept (SMC)—a powerful framework used by professional traders to read the market. In this video, we’ll break down what SMC is, how it works, and how you can use it in your own trading strategy.

What you'll learn:

  • What is Smart Money and why it matters
  • Key SMC terms: Order Blocks, Break of Structure (BOS), Change of Character (CHoCH), and more
  • An example of how to trade with the Smart Money Concept

Watch it now and stay updated with FXOpen.

TO VIEW THE FULL ANALYSIS, VISIT FXOPEN YOUTUBE

Disclaimer: This article represents the opinion of the Companies operating under the FXOpen brand only (excluding FXOpen EU). It is not to be construed as an offer, solicitation, or recommendation with respect to products and services provided by the Companies operating under the FXOpen brand, nor is it to be considered financial advice.

 
Learn the Inverted Hammer Candlestick Reversal Pattern in 2 Minutes!


Spot bullish reversals using one of the classic candlestick reversal patterns: the inverted hammer. This candlestick works across forex, stocks, commodities, and more.

In this quick video, you'll learn:

  • What the inverted hammer candlestick pattern looks like
  • How to identify and trade it
  • Common mistakes and how to avoid them

Traders of all levels can use this bullish candlestick pattern to enhance their trading strategy across any timeframe.

Watch it now and stay updated with FXOpen.

TO VIEW THE FULL ANALYSIS, VISIT FXOPEN YOUTUBE

Disclaimer: This article represents the opinion of the Companies operating under the FXOpen brand only (excluding FXOpen EU). It is not to be construed as an offer, solicitation, or recommendation with respect to products and services provided by the Companies operating under the FXOpen brand, nor is it to be considered financial advice.

 
The TOP-3 most popular trading strategies for Forex scalping


The video explains three most popular 5-minute trading strategies for Forex scalping, a technique involving multiple short-term trades on low timeframes. These strategies cater to traders seeking quick rewards but demand substantial funds, experience, and a robust plan for success.

Momo Strategy:

Setup: Uses EMA and MACD signals, emphasizing the use of a 20-period EMA and specific MACD settings on a 5-minute chart.
Entry: Long positions are considered when the price breaks above EMA and MACD is above the zero line. Shorts are taken when the price crosses below the 20-period moving average and MACD is below zero.
Take Profit & Stop Loss: Involves trailing take-profit orders and strategically placed stop-loss orders.

EMA and RSI:

Setup: Employs three EMAs (9, 55, 200) and RSI with altered levels to identify overbought and oversold conditions.
Entry: Buy when MA1 is above MA2 and MA2 is above MA3 and RSI above the level 52; sell when MA1 is below MA2 and MA2 is below MA3 and RSI below the level 48.
Take Profit & Stop Loss: Determines exit points based on RSI's high or low formations and utilizes nearest support/resistance as stop-loss targets.

EMA, MACD, and Bollinger Bands:

Setup: Uses EMAs (5, 20), Bollinger Bands, and MACD with standard settings.
Entry: Buy when 5-period EMA crosses 20-period EMA upward, price near lower Bollinger Band, and MACD histogram above zero; sell under opposite conditions.
Take Profit & Stop Loss: Closes trades based on MACD histogram highs/lows and sets stop-loss orders relative to support/resistance levels.

Watch it now and stay updated with FXOpen.

TO VIEW THE FULL ANALYSIS, VISIT FXOPEN YOUTUBE

Disclaimer: This article represents the opinion of the Companies operating under the FXOpen brand only (excluding FXOpen EU). It is not to be construed as an offer, solicitation, or recommendation with respect to products and services provided by the Companies operating under the FXOpen brand, nor is it to be considered financial advice.
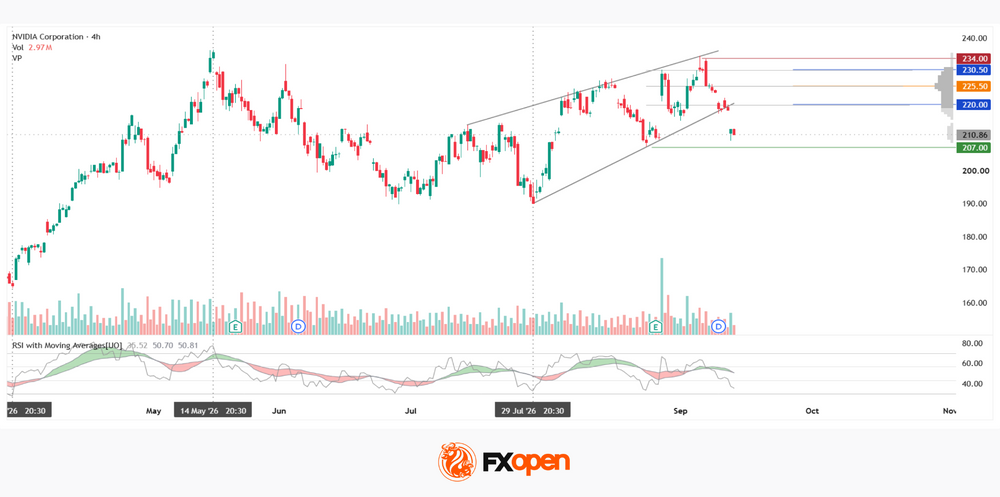
 
NVIDIA Analysis: Attempted Rising Wedge Breakout Amid Pressure on the AI Sector
nvda.jpg


Nvidia’s short-term fundamental backdrop has deteriorated. On 14 September, the company’s shares fell 3.4% amid a sell-off in AI-related stocks driven by concerns over a potential slowdown in the pace of artificial intelligence development. However, Nvidia’s business outlook remains strong, with the company forecasting revenue growth of around 70% in fiscal 2028. An additional risk factor is a US Department of Justice investigation into Nvidia’s $17 billion agreement with Groq over potential attempts to circumvent antitrust oversight.

nvda.png


TO VIEW THE FULL ANALYSIS, VISIT FXOPEN BLOG

Disclaimer: This article represents the opinion of the Companies operating under the FXOpen brand only (excluding FXOpen EU). It is not to be construed as an offer, solicitation, or recommendation with respect to products and services provided by the Companies operating under the FXOpen brand, nor is it to be considered financial advice.

 
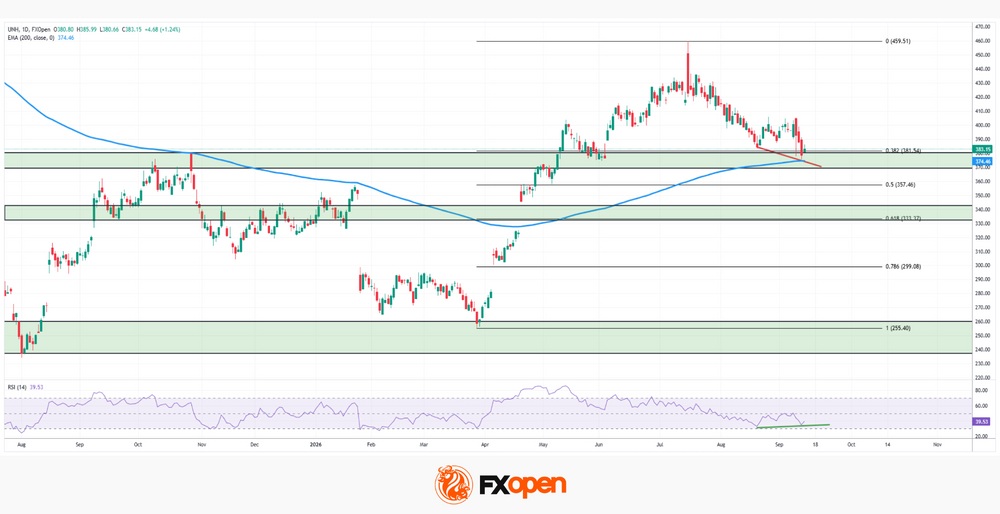
UnitedHealth: Fundamentals Are Healing, Now the Chart Must Agree
2.png


UnitedHealth finds itself in a genuinely split narrative right now, trading near $388, down about 15.9% from its 52-week high, even as the fundamental picture keeps improving. Q2 earnings beat expectations, with revenue of $112.03 billion, and the company followed through with a significant policy shift: lifting prior-authorization requirements on roughly 1,700 diagnostic codes starting October 1, a move that could meaningfully ease administrative friction with providers and support margins going forward.

Wall Street's conviction has only grown stronger as a result. Wells Fargo and Bernstein both reaffirmed Buy ratings this month, with price targets near $526 and $512 respectively, while the broader consensus, a Moderate Buy across 27 analysts, points to an average target of $456.56, implying roughly 17% upside from current levels.

The stock has nonetheless struggled to find sustained momentum, weighed down by lingering concerns over Medicare Advantage margin recovery and, more recently, the shock of losing a senior executive, an event that has triggered internal restructuring and closer scrutiny of governance and security practices.

The result: a company delivering genuinely solid operational improvement, but one whose stock price has yet to fully reflect it.

2.jpg


TO VIEW THE FULL ANALYSIS, VISIT FXOPEN BLOG

Disclaimer: This article represents the opinion of the Companies operating under the FXOpen brand only (excluding FXOpen EU). It is not to be construed as an offer, solicitation, or recommendation with respect to products and services provided by the Companies operating under the FXOpen brand, nor is it to be considered financial advice.
 
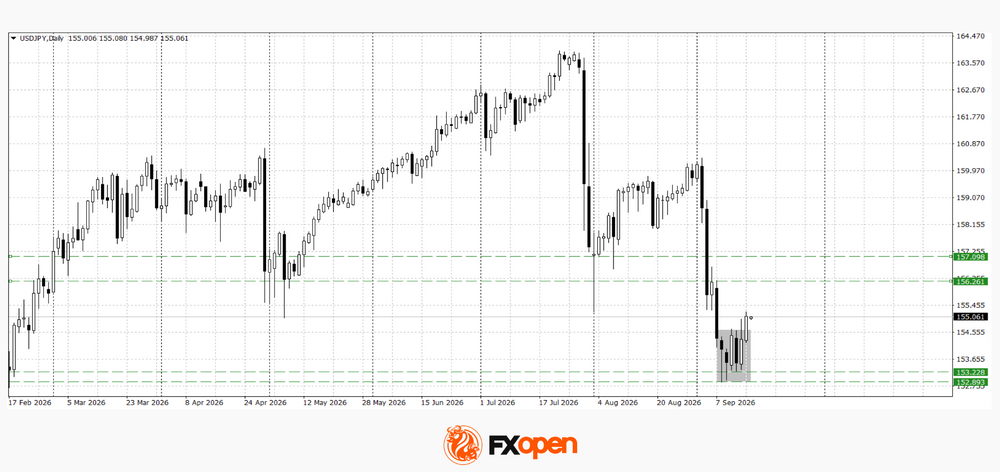
USD/JPY and USD/CAD Await Key Fed Decision
1.jpg


The US dollar is consolidating against the yen and Canadian dollar ahead of the key event of the week — the Federal Reserve meeting. The Fed is widely expected to raise its policy rate by 25 basis points to a range of 3.75–4.00%. As this move is already largely priced in, attention will focus on the updated economic projections, dot plot and press conference. Investors will assess whether the September rate hike marks the beginning of a new phase of monetary tightening or whether the central bank will prefer to adopt a wait-and-see approach.

Expectations of a more hawkish Fed are supported by persistent inflationary pressures, recent employment data and rising oil prices. US retail sales data will provide an additional reference point ahead of the meeting. Strong figures could provide further support for the dollar, although the market reaction is likely to remain limited ahead of the Fed decision.

1.png


TO VIEW THE FULL ANALYSIS, VISIT FXOPEN BLOG

Disclaimer: This article represents the opinion of the Companies operating under the FXOpen brand only (excluding FXOpen EU). It is not to be construed as an offer, solicitation, or recommendation with respect to products and services provided by the Companies operating under the FXOpen brand, nor is it to be considered financial advice.

 
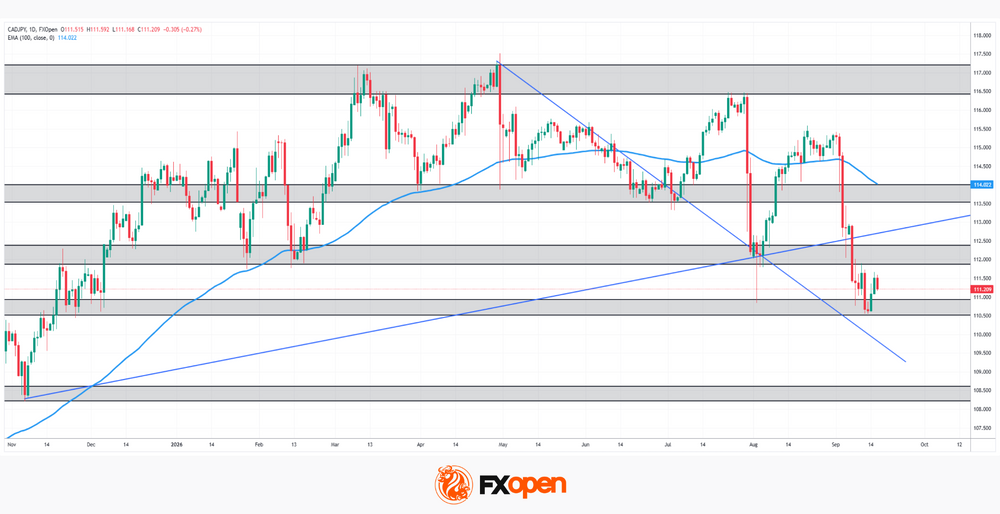
CAD/JPY: The Yen's Most Historic Move in 30 Years Meets a Fragile Support
2a.jpg


Two central banks are heading in genuinely opposite directions this week, and the tension is unmistakable. The Bank of Canada held rates steady at 2.25% on September 2, with a mildly hawkish tilt as policymakers acknowledged a broadening economic recovery alongside rising inflation risks. Since then, Canadian data has stayed firm, August CPI held at 3.0% year-on-year, and elevated oil prices, boosted by Middle East tensions, continue to provide the loonie with structural support given Canada's status as a major crude exporter.

The yen, meanwhile, is the real story of the week. The Bank of Japan is widely expected to hike its policy rate to 1.25% on Friday, its highest level since April 1995, after Treasury Secretary Scott Bessent's public pressure campaign pushed markets to price in an 80% probability of the move. The yen has already surged to seven-month highs in anticipation, with August export data beating forecasts on strong AI-chip demand, even as Bloomberg warns the scale of tightening now expected risks disrupting markets should the BOJ fail to deliver.

The result: a resilient, oil-backed loonie facing off against a yen riding its most significant policy shift in three decades, leaving CAD/JPY's next move to hinge almost entirely on Friday's BOJ decision.

2a.png


TO VIEW THE FULL ANALYSIS, VISIT FXOPEN BLOG

Disclaimer: This article represents the opinion of the Companies operating under the FXOpen brand only (excluding FXOpen EU). It is not to be construed as an offer, solicitation, or recommendation with respect to products and services provided by the Companies operating under the FXOpen brand, nor is it to be considered financial advice.
 
Back
Top