You are using an out of date browser. It may not display this or other websites correctly.
You should upgrade or use an alternative browser.
You should upgrade or use an alternative browser.
Best Thread Correlation Trading - Basic Ideas and Strategies
Okay, could somebody please tell me a MT4 broker that allows indexes and gold/silver charts. Apparently none of the US mt4 brokers allow that. Perhaps I could get a demo account and use it - one in the UK? And I am googling to find this, but no luck so far.
NVP
Guest Author
- Messages
- 37,968
- Likes
- 2,158
Okay, could somebody please tell me a MT4 broker that allows indexes and gold/silver charts. Apparently none of the US mt4 brokers allow that. Perhaps I could get a demo account and use it - one in the UK? And I am googling to find this, but no luck so far.
FXCM UK do offer all the instruments I need in the UK.............catch up with Jason Rogers on his FXCM thread here at T2W if you have any questions
This is not a recommendation or endorsement of their products though and I have no affiliate relationship with them 😎
N
NVP
Guest Author
- Messages
- 37,968
- Likes
- 2,158
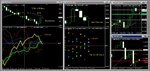
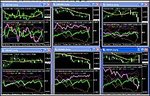
hey all heres the week to date
I've also shown the 2 trades I called on wednesday ..........
G/U is back to B/E..........(i did say tighten a while back 🙂 )
USD/CAD is doing ok
if you were trading below dailies you would have done better .........
Dow is fighting back now and (as I suspected) this was enough to hurt the Yens rise (read what I said earlier in the week regarding why I wasnt 100% into buying Yen in the pairs)......
AUD held the line all week.........So I was wrong to ignore it ........but USD was rising as well so I didnt want to trade them as a pair .....(and I do like USD in my pairs)
CAD held the sell....nice
GBP is still in trouble but bouncing now .........never mind
Trading Forex is hard enough without using tools like the Strengthmeter to increase your edge ................A strengthmeter shows you what individual currencies are doing .....it provides you with key information and clues as to what to buy , sell or indeed ignore
c'mon smell the coffee gang ..........join the Strengthmeter Crew ! 🙂
N
Attachments
NVP
Guest Author
- Messages
- 37,968
- Likes
- 2,158
hi all ...ok i'm on vacation for a couple of weeks 🙂
i'll be back online from monday for a few hours a day
will start to work on my website again and also the deluge of stuff Jedster has sent me to look at 😱
Jees .......does that guy EVER sleep?
N
some say he will only eat at 3.42 pm every day .......some say he wears his shirts back to front .............we just know him as ......THE JEDSTER !
Attachments

NVP
Guest Author
- Messages
- 37,968
- Likes
- 2,158
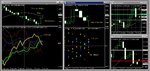
heres the closeout to the week........
both trades earlier in the week came back .......pips were there during the trades though - especially on lower TF's
I ignored the AUD buy dammit.........and should have bought it against GBP an or the CAD instead of staying on my USD pairs ....
on the daily TF's the spreads are not so much an issue re trades (vs lower TF's and ATR's)
ok see all of you later .....next week in fact 🙂 :smart:
N
Attachments
NVP
Guest Author
- Messages
- 37,968
- Likes
- 2,158
eru jpy is trading in a decent range, good trades since summer
hey there A
can you expand on that regarding a strengthmeter analysis ?
thanks
N
LittleTrader93
Newbie
- Messages
- 9
- Likes
- 0
Hey guys,
don't know if somebody already asked this but i didn't found anything using the search option in the top of the page, maybe wrong keywords?
Anyway i wanted to ask if it's possible to have more history data and look more in the past while using NVP.
Using this on M5 charts allow me to see just like 20 days of NVP instead the bar in the charts are much much more..
Thanks
NVP
Guest Author
- Messages
- 37,968
- Likes
- 2,158
Hey guys,
don't know if somebody already asked this but i didn't found anything using the search option in the top of the page, maybe wrong keywords?
Anyway i wanted to ask if it's possible to have more history data and look more in the past while using NVP.
Using this on M5 charts allow me to see just like 20 days of NVP instead the bar in the charts are much much more..
Thanks
hey LT.......
Sorry re delay....I'm on vacation in the Canaries and Jedster is on another planet somewhere........😎
the FXcorrelator will go back as far as you want it to.........it is only restricted by the settings you place on the platform you are using regarding bar history
so open it up and the past will be revealed.......:smart:
also clearly the higher the TF Bar the more you can go back...I have been back to the 90's I think or earlier ......even the 1980's when I was born ? :whistling
N
LittleTrader93
Newbie
- Messages
- 9
- Likes
- 0
hey LT.......
Sorry re delay....I'm on vacation in the Canaries and Jedster is on another planet somewhere........😎
the FXcorrelator will go back as far as you want it to.........it is only restricted by the settings you place on the platform you are using regarding bar history
so open it up and the past will be revealed.......:smart:
also clearly the higher the TF Bar the more you can go back...I have been back to the 90's I think or earlier ......even the 1980's when I was born ? :whistling
N
Hey N,
thank you but it doesnt work. I already tried to work on history bar but it stays the same, i've made a vid posted on jetscreenshot to show you what's my problem, http://screencast.com/t/Ewq444nCQ.
Thanks for your help
Jedster2001
Active member
- Messages
- 120
- Likes
- 3
Hey N,
thank you but it doesnt work. I already tried to work on history bar but it stays the same, i've made a vid posted on jetscreenshot to show you what's my problem, http://screencast.com/t/Ewq444nCQ.
Thanks for your help
Hi LT,
I'm curious, which thread, or post did you get that indicator from? To my knowledge, the basic indicator should display the period and delta in brackets, as part of the indicator name, and your screen shot/video doesn't show this, which is why I'm curious about the indicator.
It looks like you have it on a 5M chart, but I don't know what settings you have for the indicator. Anyway, you appear to hit problems around the 19th September.
I suspect the problem is data/broker related. To double check, bring up charts for all of the 8 majors, and make sure that you can see them all displaying correctly, for that date. Note that you might need a few days of data in addition to the actual day you are looking at. For example, if using a long period in the indicator (PerAvr = 500), then when looking at the 19th September, you'll need data from about the 15th.
I say it is broker/data related because, I can reproduce the same problem as you, but only if I scroll back to mid August where I have holes in my data, from my broker.
J
LittleTrader93
Newbie
- Messages
- 9
- Likes
- 0
Hi LT,
I'm curious, which thread, or post did you get that indicator from? To my knowledge, the basic indicator should display the period and delta in brackets, as part of the indicator name, and your screen shot/video doesn't show this, which is why I'm curious about the indicator.
It looks like you have it on a 5M chart, but I don't know what settings you have for the indicator. Anyway, you appear to hit problems around the 19th September.
I suspect the problem is data/broker related. To double check, bring up charts for all of the 8 majors, and make sure that you can see them all displaying correctly, for that date. Note that you might need a few days of data in addition to the actual day you are looking at. For example, if using a long period in the indicator (PerAvr = 500), then when looking at the 19th September, you'll need data from about the 15th.
I say it is broker/data related because, I can reproduce the same problem as you, but only if I scroll back to mid August where I have holes in my data, from my broker.
J
Hey J,
i did like you told me and i've no problems to see past datas (before 19th Sept) with PA, just with the indy.
Since i'm on FXCM i tried it on another broker MT4, Oanda, but it stays the same.
The version i've is this: http://www.trade2win.com/boards/att...ading-basic-ideas-strategies-fxcorrelator.mq4
I'm trying to solve this problem downloading more datas from history center, i'll keep you updated!
Thank you
LittleTrader93
Newbie
- Messages
- 9
- Likes
- 0
Ok i've downloaded more datas but i've still got the same problems mate.
However i'm using a 200/50 settings.
However i'm using a 200/50 settings.
Jedster2001
Active member
- Messages
- 120
- Likes
- 3
Ok i've downloaded more datas but i've still got the same problems mate.
However i'm using a 200/50 settings.
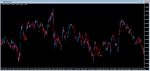
Hi,
I would say, given that I have the indicator working just fine, showing several months on a 5M chart, that is has to be a data issue. I can't see how it can be anything else. Have you checked all those 8 major pair charts carefully, to make sure there are no holes? This can be quite a laborious and time consuming task as sometimes, it can be easy to miss the holes.
As an example, I've attached a screen shot of a USDCAD chart. It looks perfectly normal, and especially when scanning through the chart quickly, it is hard to see any problem. However if you look closely, there is a small gap. It could just be a Sunday opening gap, but in this case it isn't. In fact, the chart is missing nearly a month of data! It jumps from 28th November to 23rd December!
This would completely throw out the correlator indicator. It would be completely wrong, not just here, but afterwards, since the indicator uses a moving average. The longer the period of moving average, the longer the influence of this gap.
So, carefully double check that you have all the data, for all the charts. Like I said, when I have holes in my data I can reproduce the problem you describe, but where I know my data is good, the indicator will go back as far as I have good data.
J
Attachments
LittleTrader93
Newbie
- Messages
- 9
- Likes
- 0
Hey J,
going back to 19th sept it's enough or i should go more back to see if there are past gaps?
EDIT. I went back to 19th September and there is no gap data(except weekend)
EDIT2. Ok what i'm trying to do now is download all majors history data, since i've only downloaded past datas on EUR/USD.
going back to 19th sept it's enough or i should go more back to see if there are past gaps?
EDIT. I went back to 19th September and there is no gap data(except weekend)
EDIT2. Ok what i'm trying to do now is download all majors history data, since i've only downloaded past datas on EUR/USD.
Last edited:
LittleTrader93
Newbie
- Messages
- 9
- Likes
- 0
Problem solved after downloaded all datas from history center of all 8 majors.
Thank you J and NVP!
Thank you J and NVP!
Jedster2001
Active member
- Messages
- 120
- Likes
- 3
Apologies all, for this slightly OT message...
Hi PB,
Do you remember about 5-6 weeks ago we were talking about fixed spread at GKFX? You got that crappy answer from one of their support guys saying they couldn't guarantee it.
Like I said at the time, whilst they might not be able to guarantee it, I have never known the spreads to go out, and have relied upon it quite well...
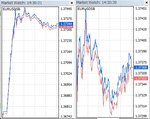
Well, attached is a screen shot showing the tick chart for EURUSD for this afternoons NFP. The first image is a little hard to see because of the big jump (obviously the exact time of the announcement), but you can see that the big and ask did stay in alignment. It is easier to see on the 2nd image which was taken about 10-15 seconds afterwards. Anyway, hopefully you can see from this that the spread did indeed, stick at 1.5 pips, right through the announcement, and afterwards, when the vol was really high!
You'd think I had shares in GKFX wouldn't you... 😆
J
Hi PB,
Do you remember about 5-6 weeks ago we were talking about fixed spread at GKFX? You got that crappy answer from one of their support guys saying they couldn't guarantee it.
Like I said at the time, whilst they might not be able to guarantee it, I have never known the spreads to go out, and have relied upon it quite well...
Well, attached is a screen shot showing the tick chart for EURUSD for this afternoons NFP. The first image is a little hard to see because of the big jump (obviously the exact time of the announcement), but you can see that the big and ask did stay in alignment. It is easier to see on the 2nd image which was taken about 10-15 seconds afterwards. Anyway, hopefully you can see from this that the spread did indeed, stick at 1.5 pips, right through the announcement, and afterwards, when the vol was really high!
You'd think I had shares in GKFX wouldn't you... 😆
J
Attachments
hey all
heres the final present of the week...Thanks to Nlenz👍 I flipped this indicator a little.... and now it will provide you with an insight into the performance of less common currencies against the main G8 dudes I trade and comment on here at T2W......
just drop this indicator on any exotic usd pair chart you have and it will automatically show how the Exotic is doing against the G8 and more importantly the ever eternal USD
The Currency will always appear in Violet Bold
I hope you have these dudes on your charts ? (see below)...sorry If not then its not going to work
and also the USD needs to be the Lead Currency in the pairing (like below) USD/XXX
if not it will not work
hope this is helpful 👍
N
Dear NVP and Jedster,
I raised this question on the other thread and does not go with that theme. So I brought it here again. This was the kind of thing I was trying to do just the same as usd/xxx currencies as below, no matter whether you change the time frame or currency pairs the bold lines goes with the currency pair you change. How can I do the same to make EUR and GBP the lead currency like eur/xxx and gbp/xxx. I tried to put the code Jester gave me but could not succeed with my limited coding ability. For now I use the standard indicator puting the color options and hide the rest and highlighted the pair I wanted and prepared about 28 templates. Thank you
Eyasu
Attachments
Last edited:
Similar threads
- Replies
- 0
- Views
- 4K