bbmac
Veteren member
- Messages
- 3,584
- Likes
- 789
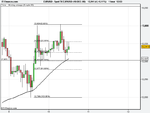
The 1hr gbpusd chart below shows cable currently in a n hourly triangle...you can see where resistance became support at the yellow and orange circled areas and now inside the triangle we have 3 tests on the 5445/50 area (circled in red) and 2 tests on the 5305/10 area (circled in green.) There are other swings above this near term x3 tests resistance area, notably 5535/40 area the previous swing hi and below the 5174/91 area the previous swing hi/lo, but a break of either areas could see them acting as support (topside break) and resistance (downside break) on any re-test pullback._


Last edited:


