Charting the levels

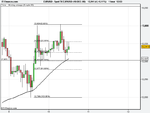
The 1hr gbpusd chart below shows cable currently in a n hourly triangle...you can see where resistance became support at the yellow and orange circled areas and now inside the triangle we have 3 tests on the 5445/50 area (circled in red) and 2 tests on the 5305/10 area (circled in green.) There are other swings above this near term x3 tests resistance area, notably 5535/40 area the previous swing hi and below the 5174/91 area the previous swing hi/lo, but a break of either areas could see them acting as support (topside break) and resistance (downside break) on any re-test pullback._

k9c2u9.gif
 
Last edited:
re postabove: price did indeed find support at the previous 1hr triple top shown in screenshot above, following an upside break and then a pullback from the 5490/00 area (previous hourly/4hr swing hi res.) rbs in this area saw a with trend follow thru to slightly higher highs, the entry caught on the lower sub 1hr t/f's...the 5490/00 area acting as resistance again on the 2nd test.

f4me13.gif
 
gbpusd

The daily chart below shows the area of the current cable resistance...the previous swing lows on this daily chart (=potential sbr) co-existing with the 23.6% fib of the 8668-4557 swing down.

be7rcl.gif
 
Last edited:
level shown holds again in gbpusd ...could like yesterdays short (lived bounce) be a potential rbs area if tested at a pullbackfrom the topside.

2j5j69j.gif
 
The potential support is the previous resistance turned rbs shown on 4hr chart, although this can be honed by dropping to 1hr chart. 4hr chart shown; (The previous swing Hi/Lo zone shown being the previous swing lo on the daily chart shown a few posts back.)

2qx5c40.gif
 
nearer term potential support is probably as below:
(taking a bounce there as i type this)
2h49paq.gif
 
  • Like
Reactions: BSD
Price has taken a 70+ pip bounce at the top of the zone shown on the 4hr chart below, (post 45 above) Within this 4hr previous swing hi/lo zone is the area shown on the hourly chart below, another previous swing hi/lo zone that may act as nearer term support if tested in the 4hr zone.
33lfhaw.gif


The potential support is the previous resistance turned rbs shown on 4hr chart, although this can be honed by dropping to 1hr chart. 4hr chart shown; (The previous swing Hi/Lo zone shown being the previous swing lo on the daily chart shown a few posts back.)

2qx5c40.gif
 
Price saw an 85pip bounce from the prev 4hr sw hi/lo zone shown on posts above (and by the red line in screenshot below.)

Screenshot below shows the potential sbr zone on this 1hr chart, but not much of a downtrend on this t/f, though

Update 1449pm: Price took an 80 bounce down from the top of the potential sbr area shown in screenshot above. As mentioned above in text, not much of a trend to re-enter on that higher t/f so not surprised that no follow thru to new lows has not been seen, as I write this, but anything can happen.
ixfrid.gif
 
Last edited:
British Pound Futures (6B 12-08)

Half an hour until close of candle
 

Attachments

  • BritishPound.jpg
    BritishPound.jpg
    86.6 KB · Views: 142
Last edited:
EUR/USD 1hourly

Confluence on this one earlier this morning:

1) Round number (1.29)

2) 50% Fib retracement

3) S/R pivot as well as bounce off rising MA

4) Pin bar !

Mikey.
 

Attachments

  • Spot FX EUR_USD (10-DEC-08).png
    Spot FX EUR_USD (10-DEC-08).png
    10.7 KB · Views: 167
Last edited:
British Pound Dec08 again:

Pin combined with 2 failed probes through Level 2 Supply Line. (Just bounced off)

Sell stop placed at 1.4806

First problem area is the Level 2 Demand Line, a breakout through that could see a test of the swing low

(Now up to Page 70 on Making Money thread!)
 

Attachments

  • BritishPound.jpg
    BritishPound.jpg
    88 KB · Views: 156
Last edited:
Top