N Rothschild
Legendary member
- Messages
- 5,296
- Likes
- 603
I do enjoy a bit of soybean action! never been a fan of FX altho i do see the appeal for many people. Will have a look for some individual stocks to post up if anyone is interested?
I do enjoy a bit of soybean action! never been a fan of FX altho i do see the appeal for many people. Will have a look for some individual stocks to post up if anyone is interested?
http://img.skitch.com/20081101-b9uigmjfb7888iatwjmg5mqbae.jpg
Should be an interesting start to the week.
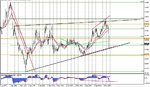
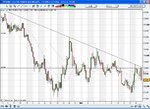
The attached screenshot is the Gbpusd daily chart.
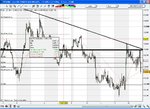
You can see that previous support level (swing lows) and the resultant potential sbr zone that falls between the green horizontal dotted lines. The steep decsending resistance t/line currently cuts through the zone (there are others less steep) and there are the following fibs in the zone;
23.6% 8667-4557 @ 5532
23.6% 7633-4557 @ 5288.
G/L