Breakouts

Events since I last posted:
  • Silver stopped out for more than 1R
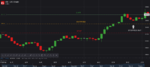
  • Opened and closed a Gasoline trade for a profit.

View attachment 280229

Gasoline exit was spectacularly well timed if I say so myself

1589995282419.png
 

After a strong move up the price reversed abruptly, behaving suspiciously as if it had hit resistance. Looking at a longer term chart there is some choppiness and prior to that resistance. Would it have been prudent to have not taken the trade because of this? I had marked out what I regarded to be more significant resistance levels higher up and adjusted my approach accordingly. Every trade is straight into a resistance level if you look back far enough.

1590047947261.png
 
Last edited:
After a strong move up the price reversed abruptly, behaving suspiciously as if it had hit resistance. Looking at a longer term chart there is some choppiness and prior to that resistance. Would it have been prudent to have not taken the trade because of this? I had marked out what I regarded to be more significant resistance levels higher up and adjusted my approach accordingly. Every trade is straight into a resistance level if you look back far enough.

View attachment 280267

I attempted to start a thread discussing this topic as nobody reads my journal but this got deleted for violating the forum rule relating to duplicate content so I shall have to discuss the subject here...with myself.

In hindsight, looking at the first two points circled this is a significant level which I should have been watching, and it was confirmed as still relevant by the third point circled (and the fourth touch I didn't circle). I should have had this level marked.

What I should do with that information is another question. This is prime retracement territory and tightening stop makes a premature exit highly likely. The other option is to not take the trade as there is a significant level in close proximity to entry which I think is the correct one. In fact this is what I do already, I just missed the level. Dilemma solved.

This does raise the question of how far back I should look. Do I choose an arbitrary length of time? Shall we say six months? Sure, why not.

Edit: I performed a little "five whys analysis" and came to an interesting conclusion:

Strong move reversed and stopped out for loss -> why? -> I missed a significant support level -> why? -> I did not check the chart thoroughly -> why? -> I did not want to pass up the trade -> why? -> acquisitiveness
 
Last edited:
“If you know the enemy and know yourself, you need not fear the result of a hundred battles. If you know yourself but not the enemy, for every victory gained you will also suffer a defeat. If you know neither the enemy nor yourself, you will succumb in every battle.”
 
At BE on new US crude position. Moved to BE a little early as it looks like a wild one.

1590149589722.png
 
I have been thinking about today's US Crude trade.

My stop price, entry/BE price and the price at which profit is 1 X R are marked on the attached chart. My plan, when I follow it, is to move stop to BE when price hits the 1 X R level. This is what I did today, albeit a little prematurely, and was stopped out shortly thereafter after which the price retraced and made new highs. This is an ever present danger.

What I am considering doing is that when the price reaches 1 X R, instead of moving the stop remove the stop altogether and purchase a 3240 put option (in this example) which presumably would be cheap given the sharp increase in price and if the price were to fall the gains on the put would offset (in theory) the losses on the spreadbet. It will require the options be cheap enough to not erode any profit from the trade and will require quick fingers and some planning preparation before hand.

I opened a demo account with my broker today for testing purposes.
 

Attachments

  • Oil - US Crude_20200522_16.34.png
    Oil - US Crude_20200522_16.34.png
    52.7 KB · Views: 170
I was just contemplating how the price often seems to reverse, or at least stall, at either my entry point, stop loss or target levels. It is something I have though about a while and reading the above words "like everybody else" gave me an aha moment. The reason is that most people are doing more or less the same thing.
 
May 2020 Review (Balance: £27,967.20 , P/L: +£3,962.12 / +17%)

Looks like no trades for me today so I shall get the monthly review out of the way before the weekend.

Summary
  • Good month with +17%. That being said plenty of room for improvement
  • With new balance risk percentage is now 3.6%.
  • Notable that all my profits came from oil and derived markets.
  • No repeat of last month's infraction whereby I widened my stop on a live trade.
  • Confusion and doubts that arose following DAX trade which was up £2,200 and closed for BE have been largely resolved and I feel more comfortable with my plan with regards to exits at significant resistance levels.
  • Should not have taken Ripple trade and have removed from my watch-list. Too volatile and spreads too wide. I shall be doing more due diligence prior to adding any future potential markets.
  • Missed a rocket of a silver move and I don't know why or how to ensure this does not happen in future.
  • Took a gold trade right into strong multi-week resistance which got stopped out for loss. Have added an item to my checklist to check daily TF.
  • Closed big US Crude trade too early where there was no reason to except that I could no longer sit on my hands.
  • ~20 trades suggests over-trading. Will start to forgo more trades where there is strong resistance between entry and target area. I may even stop trading forex, we don't seem to get along.
  • 35% win rate from IG stats is not accurate. This includes trades which were closed for a few £ loss which I would count as a scratch. Have made a start on my database but got distracted from it's core purpose by prospect of downloading data real time via IG API.
  • Still looking into options and how they can enhance my strategy.
IG Stats

1590736312272.png


1590736346975.png


1590736448589.png

1590736472984.png


1590738944949.png

1590738970441.png
 
Last edited:
Output from first version of results database. It amalgamates trades with the same opening ref and different closing refs (broker analytics count these as separate trades) and counts trades greater than -100 and less than 100 as a scratch.

1590910173147.png
 
Last edited:
Output from first version of results database. It amalgamates trades with the same opening ref and different closing refs (broker analytics count these as separate trades) and counts trades greater than -100 and less than 100 as a scratch.

View attachment 280837

These are consolidated results:

1591039213663.png


I am upset that the Gasoline mistake will show up in the lossMax column forever.
 
Currently long Investec. I don't ussually trade equities. I have been looking into adapting this strategy to trade for my ISA and came across this, it was too good to pass up on my spreadbetting account.

1591390345875.png
 
Top