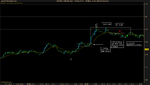
This morning US session was hell! It was a major chopfest. I didn't stick around for FOMC.
I've decided to take a bit of a break from the screens and will be doing some backtesting in the next few days. I'm particularly interested in exploring August.
Since I'm not a part of ProRealTime (I don't want a fixed cost eating away at me each month, not until I'm trading enough size to make it worthwhile), I'm sticking to the 30 second charts. Unfortunately Oanda doesn't let you see historical 30 second data past a few hours for some reason, and Metatrader doesn't support 30 second charts, so I used an alternative method which is a bit time consuming but it did the job.
Gain Capital has tick data available for free, so I am taking their data into Excel and formatting it for use in Ninjatrader which has 30 second charts and also tick charts.
In case anyone's interested:
1) You download Gain's tick data which is in CSV format.
2) You open it in Excel.
3) You delete the first three columns (lTid, cDealable, and CurrencyPair)
4) Delete the topmost row with the headings. Now you just have numbers.
5) Select and cut out the Ask column and paste it into the sheet behind. We will create a separate ask sheet.
You should now have just two columns, the date column (which previously said RateDateTime), and the price column (Bid).
6) We need to format the date to conform to Ninjatrader. Select the date column (leftmost column). On the Home tab select "Number", then "Custom". Enter into the custom format blank yyyyMMdd HHmmss and do not forget to include the space in between them!
7) Fill the empty column on the right with 1's. So you don't have to go down 2000000 rows, you write down a 1 into any empty cell, cut it out (Ctrl-C), then select the entire empty right column and then paste (Ctrl-V) into it. You will have to go down and trim the extra 1s at the bottom, which you can do by scrolling to the bottom of the last valid row with digits, then selecting the first extra 1 cell without any price or date data next to it, then holding down shift and pressing pg-down repeatedly to the end of the sheet. Then click delete and the extra 1's should disappear. I'm sure some excel wiz can do it faster than this 🙂
8) "Save as" the excel file as Text (Tab delimited). Title it $EURUSD.Bid.txt and observe case!
9) Open it in Notepad, and select replace. In "Replace what" insert a tab, in "Replace with" insert a semicolon, and do not insert spaces around it. Save the file. Repeat steps 6-9 for the Ask price, if you need it (I don't), and in that case create a separate $EURUSD.Ask.txt file.
10) Save the file and import it into Ninjatrader using Tools -> Historical Data Manager -> Import. Be sure you have the $EURUSD instrument available (Tools -> Instrument Manager) or else it will bark at you and give you the dreaded "Instrument is not supported by repository" in the log.
One hell of a process but it gets the job done. In Ninjatrader you can view the data as ticks or as 30 second charts or any other variant thereof.