Bob Volman Price Action Scalping

Thanks for that! It actually makes my life much easier because I just download CSV in 30 second format and can display the data directly in Excel in candlestick format without Ninja Trader. Actually, I can even display it in Dukascopy's online chart which works very well too.

BTW you know you can request tick data from OANDA if you have more than $1000 in live account right? You need to put a request first but they usually come back to you really fast. But they don't give you last two months' data.
 
BTW you know you can request tick data from OANDA if you have more than $1000 in live account right? You need to put a request first but they usually come back to you really fast. But they don't give you last two months' data.

Yes, they said it would take them two weeks possibly and the two month gap you mentioned, so I tried alternative routes. I'm going to order from them anyway, see what kind of data they give. The best businesses strive not only for increased revenues but lower expenses :smart:
 
Yes, they said it would take them two weeks possibly and the two month gap you mentioned, so I tried alternative routes. I'm going to order from them anyway, see what kind of data they give. The best businesses strive not only for increased revenues but lower expenses :smart:

I did a few requests and the data arrived in an hour or so in all cases.
 
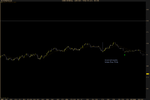
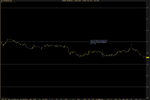
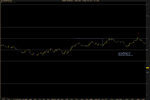
Last two days have been pretty slow so I started paying more attention to the price movement even when I didn't see any potential for a trade. I've noticed that weak range-break-type setups consistently make those traders who take them lose money (breaks with no buildup or into support/resistance). This means that taking the opposite side of those trades potentially can be a profitable strategy. Obviously everything is not so nice and easy and there is a large degree of subjectivity with stop and profit orders placement. But I think there is a fundamental edge in this idea and I will start keeping an eye on those situations from now and maybe will be able to come up with more objective rules or guidelines. Any thoughts?
 
Here is what I mean:
 

Attachments

  • 1.png
    1.png
    20.7 KB · Views: 210
  • 2.png
    2.png
    20.6 KB · Views: 212
  • 3.png
    3.png
    20.7 KB · Views: 199
Code:
Here is what I mean:

I would only recommend boomerang IRBs for that strategy. It looks good in hindsight, but in real time, it would be hard to guess where the market turning point is and you may find ourself getting stopped out a lot. I think what you're referring to is a popular strategy among some traders, but they use a wider stop. Over time, it might give a decent return but would not be as profitable as Volman's strategy. I actually started out trading with a similar strategy but it is harder to limit your losses.
 
Code:

I would only recommend boomerang IRBs for that strategy. It looks good in hindsight, but in real time, it would be hard to guess where the market turning point is and you may find ourself getting stopped out a lot. I think what you're referring to is a popular strategy among some traders, but they use a wider stop. Over time, it might give a decent return but would not be as profitable as Volman's strategy. I actually started out trading with a similar strategy but it is harder to limit your losses.

I have been in many trades myself when I was buying or selling the extreme of the move seeing the price reverse couple of pips after my entry. I definitely wouldn't try to pick tops or bottoms but usually if the break is false, it proves to be false fast enough. Of course without any numbers it's just talking, but as I mentioned, I'll try to pay more attention to these "setups" and will see what the result is.
 
1025 failed ARB.png

Not much action today. So far all I have seen is this, which I think is a failed ARB. Basically a BB inside a range. Note: ARBs are my worst setup right now, so take this with a grain of salt. I did think price may be a little overextended at this point, but it probably had decent odds given the conditions. Things in favor of the trade:

1. Good squeeze
2. BB on the inside of the barrier with several bearish dojis/false upside breaks.
3. Possible support from the 80 level. If this break succeeds, there could be a clear path to the 60 level.

I thought this break needed to be watched closely because price made a pretty big run from the top of the range to the bottom ("big" is relative, but things are slow this morning). There was a test of support that offered a re-entry. I would have liked this a lot better if it had been an actual ceiling test but it was 1-pip short, another reason to watch it closely.

Price hesitated after the break. Support held at the barrier, but given the lack of follow-through, I thought it was best to exit at that doji that took out the high of the bullish bar at 1.2967, which creates a little higher bottom. That looked especially bad to me because of the hesitation. We had already tested support twice. An exit here would be between break even to 2 pips profit depending on slippage.
 
Last two days have been pretty slow so I started paying more attention to the price movement even when I didn't see any potential for a trade. I've noticed that weak range-break-type setups consistently make those traders who take them lose money (breaks with no buildup or into support/resistance). This means that taking the opposite side of those trades potentially can be a profitable strategy. Obviously everything is not so nice and easy and there is a large degree of subjectivity with stop and profit orders placement. But I think there is a fundamental edge in this idea and I will start keeping an eye on those situations from now and maybe will be able to come up with more objective rules or guidelines. Any thoughts?

I had a similar idea a few months ago. It was more like a failed ARB really. The price had formed a block just beyond the range barrier and instead of breaking higher the price broke lower. I went short and the price wasn't far off reaching its target but it ultimately failed. I wasn't tight enough with my stop.

I haven't traded this way since but it is still in the back of my mind and I would probably try it again if the right opportunity came along.

Here is the chart.
 

Attachments

  • 15.png
    15.png
    28 KB · Views: 205
Last edited:
I had a similar idea a few months ago. It was more like a failed ARB really. The price had formed a block just beyond the range barrier and instead of breaking higher the price broke lower. I went short and the price wasn't far off reaching its target but it ultimately failed. I wasn't tight enough with my stop.

I haven't traded this way since but it is still in the back of my mind and I would probably try it again if the right opportunity came along.

Here is the chart.

Since I get caught in these weak RB's very often, this would be the approach I'd try to build the setup around:

1/ We have a range that gets broken in a way we wouldn't trade.
2/ Price doesn't continue or reverse - it forms a BB on top of the range and starts squeezing against the barrier from the other side.
3/ When the barrier gets broken, we enter.

So in essence it'd be a mini-range just above a recently broken bigger range, sharing the same barrier, but in the other direction. You'd want the squeeze for the same reason you want the squeeze when you trade RB. About fading one directional moves, I don't know how I'd evaluate the point of entry.

But I'm not even able to trade profitably this method alone, so adding setups I made up is probably not a smart thing to do.

Edit: The red arrow trade is a proper RB.
 

Attachments

  • x.png
    x.png
    18.5 KB · Views: 227
1025 RB.png

It's about time we got a setup! This RB looks much nicer than the earlier possible ARB. I didn't like the location as well, being in between two 20 levels, but it had plenty of buildup and a very distinguishable head and shoulders pattern. As you can see, I spaced my chart out a little more today. It threw me for a loop at first, but I like it better now. Since the candlesticks aren't touching, I find it easier to read the individual bars. Some patterns can be read a little easier and seem less blocky this way, and I think it may help me identify the proper squeeze easier. Anyways, it's all preference, but it's something to think about.
 
But I'm not even able to trade profitably this method alone, so adding setups I made up is probably not a smart thing to do.

I feel the same, it's not a bad idea and I have thought about it myself, but personally I don't want to tinker with new approaches like that until I'm way ahead and comfortable with Volman's method. Then if I lose a little on an experiment, I won't really care. Similarly, I had started reading Al Brooks books for some more price action knowledge, but stopped because I thought I would benefit more from total focus on Volman's book/charts until I was really consistent. I don't want to overload in the early stages.
 
It's about time we got a setup!

Yeah, I grabbed that one successfully after two bad ones earlier today. One was a break in the opposite direction that happened a bit earlier, I saw that as an IRB and then got smacked hard back in the original trend direction. The second bummer I entered too early on the break to the downside and then got punished rightfully for it.

I personally notice a lot of counter-trend ideas in the market but the problem as someone mentioned it earlier is getting good entries and having clear stop points - the take profit points are actually easier to see because you watch where your opponents have their stops.

The problem is that whenever you go against the trend you always have traders who still want the trend to continue and they will use the better level to get back into the game. That is why either you get a good run in your favor (when you're right and they head for the exits), or you get stuck in heavy chop as they fight over the level. The biggest problem with the Euro is it often gets stuck in heavy chop and you have to know when to stay the hell out of that area. One Euro trader I know was always big on watching for distant chart congestion to avoid this problem. Bob by contrast seems to ignore everything after 90 minutes.

Regarding counter-trend ideas, Larry Williams' idea that a double bottom with a lower second bottom which fails (and a double top with a higher second top that fails) often has the best follow through, because nobody expects it to happen after seeing a higher high. That is somewhat opposite of Bob's ideas which all work on gradual price cues. The problem with the Williams' method is that its tougher to place a solid stop with good risk reward. With Bob's method you can set a lower stop, but woe to you if the market entered chop zone.
 
Attached is an example of what I was just talking about. As you can see, there is a pretty clear signal in this case but the problem is the risk reward is not solid. You have probably after commissions and slippage a 4 point move, and you have to allow 4 points plus commission for an initial stop, so a slightly negative risk/reward situation. If you get good at filtering these, you could probably do okay long term.

Notice btw that I always display the bid and ask spread with the price line. That helps give me a visual perspective on risk reward because when you scalp, you can lose sight of the spread, as Neiderhoffer calls it, "Gambling the vig"
 

Attachments

  • EURUSDCountertrend.png
    EURUSDCountertrend.png
    29.7 KB · Views: 192
1025 BB.png

Here's a BB/RB that just happened. I skipped this one because almost the entire setup consisted of dojis and I thought maybe followthrough would be weak in the 50 level. However, the head and shoulders pattern is pretty clear with a nice squeeze. I am wondering what your thoughts are on these low volatility situations. I think I need to stop skipping them if they're properly built up and not worry as much about it.

This low volatility is somewhat similar to what I've been noticing in the afternoon. I've been keeping an eye on the afternoon US session some lately. It's really, really slow. Sometimes the EUR/USD doesn't do anything, but sometimes it does produce RB and IRB patterns. They might sometimes take 30 minutes to an hour to reach the target after a break, but they really don't seem too much less reliable, just painfully slow. Some breaks are quicker, but overall they seem slower. Even if they fail, as long as they are properly built-up, they often give an exit at break even or a little bit in the positive. Occasionally the IRBs turn around at the barrier at, say, 8 pip instead of making it to 10. I thought I read in the book that support/resistance zones are more likely to hold in slow/afternoon markets. This probably explains that part of it, but sometimes they still break the barrier.

I would like to start taking some of these setups in the afternoon if I decide the odds are still favorable, which so far I think they are. On the plus side, the afternoon session is so slow that I can get other stuff done and just check the chart periodically for developing setups. Because the breaks are slower, I may reduce my lot size more for my own comfort. I find that the AUD/USD has more RBs than the EUR/USD in the afternoon lately, although I'm not sure why this is. I probably see an average of 1 setup a day on the AUD/USD in the afternoon, it's almost always an RB or an IRB.
 
View attachment 148234

Here's a BB/RB that just happened. I skipped this one because almost the entire setup consisted of dojis and I thought maybe followthrough would be weak in the 50 level. However, the head and shoulders pattern is pretty clear with a nice squeeze. I am wondering what your thoughts are on these low volatility situations. I think I need to stop skipping them if they're properly built up and not worry as much about it.

I was considering taking this BB but two factors made me wait more: a bit of clustering action just below and 50 level. If there was one more lower high in the form of at least 1pip break to the upside I would definitely take it. I think they've been working well recently.
 
I was considering taking this BB but two factors made me wait more: a bit of clustering action just below and 50 level. If there was one more lower high in the form of at least 1pip break to the upside I would definitely take it. I think they've been working well recently.

I wondered about that too, if that hadn't been there I probably would have shorted this setup. Rejection at the 60 level made for a strong case but I couldn't decide if there would be trouble at the 50 level or not. Probably pretty good odds, but I wasn't sure at the time. I am starting to think that in a continuation trade, that blocky patch might not pose too much of a threat to a properly built-up RB (as long as there's not too much clustering), but if it were the first time it broke from a sideways market, I'd definitely give it more weight. What do you think?
 
It's hard for me to judge not having big enough sample size. I did what I felt more comfortable about. If we see similar setups getting to the target frequent enough maybe we can relax our view on 50level significance under these conditions. Move down before this BB formed was actually a breakout from a range which made me more hesitant. In a stronger trend I suppose odds would be on the side of taking the trade.
 
E1: I have to pay attention to the time before I enter any trade. I think I was lured in by that beautiful squeeze and the fact that there was enough room for a 10 pip scalp (possible magnetic effect to the 60 level.)

S1: The 7-8 pip stop put my off of this trade. I was not willing to risk that much for a setup that had to crack a 20 level to reach target. An 8 pip stop should be acceptable to me and I should pay more attention to the overall price action before considering the risk levels. A mistake on my part I guess.

E2: I probably would hesitate to take this if I had taken S1. But I think seeing S1 hit target may have been a factor in me deciding to take this one. Still, I think this was good trade. I had one of those few moments where I remembered that it's not my job to figure out if there's going to be a 50 level fight (unless the chart clearly shows something to that effect) and that I should just take a valid trade if the risk was acceptable.

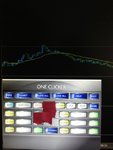
I did not let this hit target because I was anxious about the outcome. I was doing quite well in managing my trades because I used sticky notes to cover out my current P/L in my ticket window (see attachment) but towards the end I took a quick peek at my paper profits and decided to bail 9+ pip in the green.

What do you guys do to help manage you trade better? Do you guys hide your pip count while in a trade?
 

Attachments

  • Untitled picture.png
    Untitled picture.png
    17.2 KB · Views: 232
  • Untitled picture1.png
    Untitled picture1.png
    14.2 KB · Views: 197
  • Untitled picture2.png
    Untitled picture2.png
    16 KB · Views: 208
  • KURW0l.jpg
    KURW0l.jpg
    42.4 KB · Views: 254
View attachment 148234

I would like to start taking some of these setups in the afternoon if I decide the odds are still favorable, which so far I think they are. On the plus side, the afternoon session is so slow that I can get other stuff done and just check the chart periodically for developing setups. Because the breaks are slower, I may reduce my lot size more for my own comfort. I find that the AUD/USD has more RBs than the EUR/USD in the afternoon lately, although I'm not sure why this is. I probably see an average of 1 setup a day on the AUD/USD in the afternoon, it's almost always an RB or an IRB.

I don't think I would have the patience to trade during the afternoon NY session but as Volman has shown there are opportunities to be had. I don't like low volatility situations myself but I don't worry too much about it during the London-NY overlap.
 
Top