You are using an out of date browser. It may not display this or other websites correctly.
You should upgrade or use an alternative browser.
You should upgrade or use an alternative browser.
BLS
Established member
- Messages
- 642
- Likes
- 229
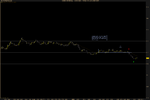
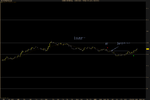
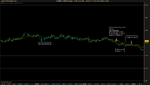
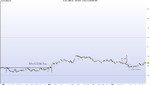
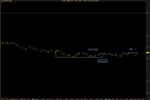
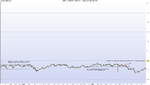
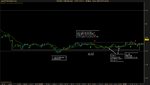
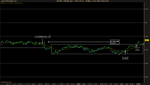
Two trades today.
If you had traded the first RB would you exit early or ignore the double bottom and move tipping point to 1.3058 thus getting 10 full pip?
The tipping point for the first RB could have been moved to the barrier line after that mini double bottom formed. I probably would've bailed at 1.3058 since price was moving really slow and could not follow through on the break of the 60 level (though this is aggressive since I'm bailing under the 20EMA).
Attachments
Two trades today.
If you had traded the first RB would you exit early or ignore the double bottom and move tipping point to 1.3058 thus getting 10 full pip?
Hi Cha-ching,
As you can see I didn't trail my stop aggressively on the trade you took, letting it range a bit first. I did get my 10 pip out of it, but on the next RB you did better putting your tipping point closer to the market. Generally I don't think we broke any rules, it's just a matter of personal preference I think.
Giorrgi
Well-known member
- Messages
- 253
- Likes
- 0
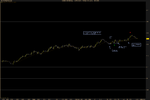
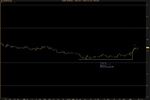
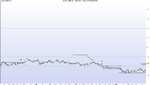
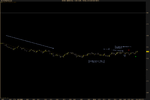
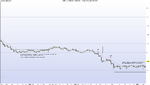
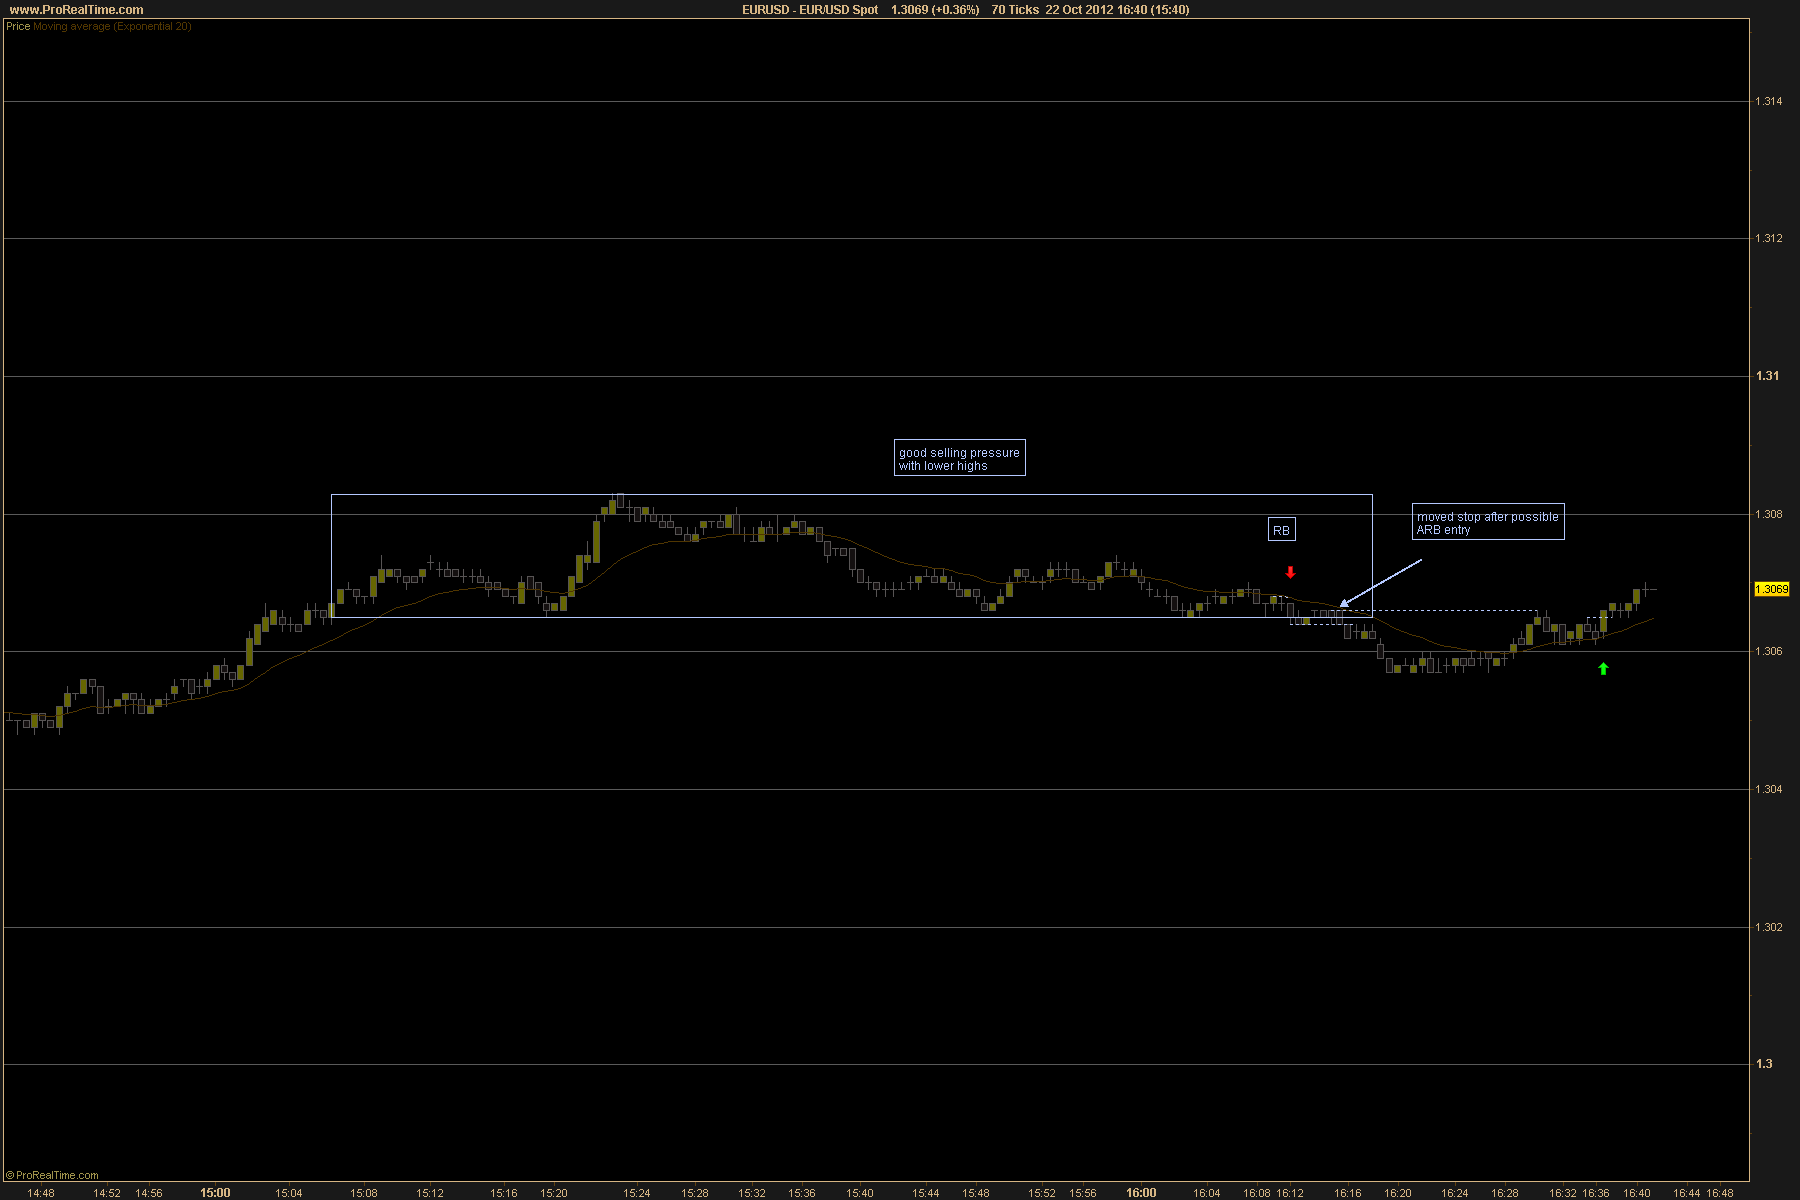
Anybody took this DD at 15h30 London time? If not, why ? Looked good enough to me.
Edit: it's actually on Vanica's last chart from today, if you wanna check it in pro realtime.
http://www.trade2win.com/boards/att...-bob-volman-price-action-scalping-221012f.png
Edit: it's actually on Vanica's last chart from today, if you wanna check it in pro realtime.
http://www.trade2win.com/boards/att...-bob-volman-price-action-scalping-221012f.png
Attachments
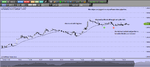
Anybody took this DD at 15h30 London time? If not, why ? Looked good enough to me.
My main concern was 80level resistance. I pay more attention to 20levels trading with-trend setups as they have less build-up and require more immediate follow-through.
BLS
Established member
- Messages
- 642
- Likes
- 229
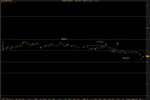
Anybody took this DD at 15h30 London time? If not, why ? Looked good enough to me.
Edit: it's actually on Vanica's last chart from today, if you wanna check it in pro realtime.
http://www.trade2win.com/boards/att...-bob-volman-price-action-scalping-221012f.png
As you noted the pullback was rather short. Also the dojis weren't compressed compared with the other pullback bars.
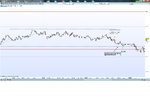
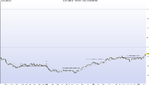
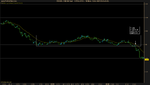
Took one trade today but I didn't manage it well. I have to work on that this week.
Attachments
cha-ching
Active member
- Messages
- 148
- Likes
- 9
BLS: thanks for the tips. I have to read more about moving tipping point to barrier lines from the book.
vanica: yes I trailed more aggressively on first RB b/c I too found the entry aggressive (as BLS did). As for the second one I moved it quickly because it's at 20-level. Another reason (which shouldn't be) is there's still emotion (fear of losing). I'll be working on it. You did a great job today!
vanica: yes I trailed more aggressively on first RB b/c I too found the entry aggressive (as BLS did). As for the second one I moved it quickly because it's at 20-level. Another reason (which shouldn't be) is there's still emotion (fear of losing). I'll be working on it. You did a great job today!
stehlikpetrmsncom
Active member
- Messages
- 194
- Likes
- 3
Guys, what is your decision making process for situations when you are in a trade and price starts clustering on the favorable side of the ema? Would you say that these clusters represent possible accumulation of previous pressure and hence the tipping point should better be re-adjusted? Or do you look for additional technical signs like previous support/resistance to evaluate the significance of this cluster?
shotgun77
Active member
- Messages
- 128
- Likes
- 2
Hi, Vanica,
I don't understand all of your question so will only answer part of it.
If I see a cluster, I usually think BB. So I move my protective stop to the unfavorable side of the cluster.
I think Bob would say the meaning behind the cluster doesn't matter -- it is all just information. 🙂
I don't understand all of your question so will only answer part of it.
If I see a cluster, I usually think BB. So I move my protective stop to the unfavorable side of the cluster.
I think Bob would say the meaning behind the cluster doesn't matter -- it is all just information. 🙂
cha-ching
Active member
- Messages
- 148
- Likes
- 9
Hi, Vanica,
I don't understand all of your question so will only answer part of it.
If I see a cluster, I usually think BB. So I move my protective stop to the unfavorable side of the cluster.
I think Bob would say the meaning behind the cluster doesn't matter -- it is all just information. 🙂
I think he meant cluster during a trade, like the one in #923, the second chart.
I haven't made that many trades so far, but I would look at technical significance of the cluster (in relation to previous S/R), which is what Bob emphasizes. If there's no technical significance for the cluster then it's just bull/bear fighting (just market information, hehe), I'd stay put and watch -- I'm in the black anyway. One thing I can think of is if the cluster crossed 20ema, then maybe I'll need to move the tipping point, but that's because 20ema also signifies the cluster in my opinion.
Hi, Vanica,
I don't understand all of your question so will only answer part of it.
If I see a cluster, I usually think BB. So I move my protective stop to the unfavorable side of the cluster.
I think Bob would say the meaning behind the cluster doesn't matter -- it is all just information. 🙂
In the chapter on tipping point technique Bob normally moves his protective stop after the break of ema. If he is long and ema is broken to the downside and then price forms higher low, he moves the stop 1 pip below this low. What I was curious about after today's trading session was whether the appearnace of clustered price action requires the adjustment of a stop. A good example are trades taken by Cha-ching today. They both stalled afer moving into positive for several pips and formed horizontal block. The first one reached the 10pip target, but second one reversed on the break of the block.
TonyIommich
Member
- Messages
- 79
- Likes
- 21
Just got through all of Bob's charts. Fascinating to pour over them, he took the time to make some great comments.
A couple of observations:
* Bob further develops some concepts that he put out in the book, for example you see him introducing trend lines with flag/pennant like setups.
* You notice that Bob is good about introducing significant discretion, including ideas of sharply trailing stops when a setup is aggressive. He also shows flexibility with a different market environment, for instance talking about how SBs are very tough to trade these days (I'll admit I also observed the same)
* Bob is less focused on the actual setup and more on the surrounding price action.
* It can get quite confusing what is the difference between the setups, you realize a lot of it comes through developing a technique that is not always easy to articulate in clean language (e.g. IRB vs RB, etc), which is what discretionary trading is all about.
* Bob seems like he trades for quite a while, he's trading the European open and he goes into the New York afternoon. Looks easily like a 12-13 hour work day!
What I'm really curious about was how he handled the total doldrums in August. That was a very tough market to crack.
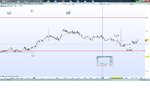
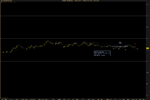
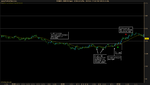
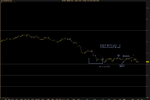
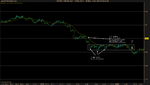
Got completely chopped in the morning range. I'm sorry for a bit unclear charts, not sure why they were saved this way. I would be grateful if someone could comment on the first trade (it was a RB).
Thanks.
Thanks.
Attachments
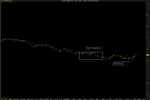
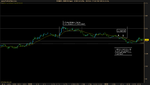
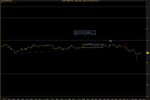
Still haven't figured out why the borders of rectangles are not shown properly on my charts, but hopefully trades are clear enough. The first one is RB. Looked like one of those counter-trend ranges with bottoming pattern inside. Second trade is very similar to IRB from 8th October on Bob's charts. I agree that some of the trades I've taken today are quite aggressive. That's why I will appreciate any help with trying to understand where this aggressiveness was excessive.
Attachments
samich1262
Well-known member
- Messages
- 293
- Likes
- 3
Still haven't figured out why the borders of rectangles are not shown properly on my charts, but hopefully trades are clear enough. The first one is RB. Looked like one of those counter-trend ranges with bottoming pattern inside. Second trade is very similar to IRB from 8th October on Bob's charts. I agree that some of the trades I've taken today are quite aggressive. That's why I will appreciate any help with trying to understand where this aggressiveness was excessive.
The 2nd one is nice, I spotted that one as well. For the first trade, I think it's just too soon for a reversal given the bearish pressure to the left. There were some similar examples from Bob last week, but the difference was that the bulls were able to find support in the 50 level and win that fight. Those usually consisted of a head and shoulders pattern, maybe a higher double bottom and a squeeze. So I think it was the combination of a nice reversal pattern and a significant level holding up that led Bob to take those trades against the previous pressure. Otherwise I keep looking for continuation.
stehlikpetrmsncom
Active member
- Messages
- 194
- Likes
- 3
Similar threads
- Replies
- 15
- Views
- 8K