Bob Volman Price Action Scalping

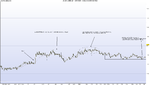
Now what does that mean price technically? Is the barrier significance strengthened and should we look for continuation (withtrend) setup, or is the return below the barrier sign of bearish strength?

Hmm. My first thought is that we either need a longer sideways setup, or a significant pullback. My guess is bulls are starting to run out of steam, but bears are still unable to gather enough strength to push price below that line of 5. So I think we should still be looking for a bullish setup here, it just needs to have a more buildup than something we would have taken during the trend. A nice head and shoulders pattern in a BB would be good here. Personally I wouldn't take a bearish trade right there, I would expect that the bulls are still hanging around for better prices. I would either look for a bullish BB/IRB with a nice squeeze, or price might start ranging. Hard to say completely without knowing what levels this formed at. If 5 were right above a round #, I would be more bullish, but if that line of 5 formed right below a round # I'd be a lot more cautious.
 
I added a schematic picture:
I don't understand your schematic because I didn't think it looked like the chart of topic. I looked through week 39 charts and tried to find something similar to the schematic. I found these charts that might be similar: #11 @ 14.24 minutes, #17, #24, #27

Is any of those what you are talking about?

This
 

Attachments

  • pttern.jpg
    pttern.jpg
    57.2 KB · Views: 165
  • pattern.jpg
    pattern.jpg
    19.7 KB · Views: 181
Looks bearish to me. You have 3 stalls on the way up. Price looks like it is struggling to get somewhere.

Stall 3 formed a horiz top and you could say it tried 3 times to make Hr High.

Then it pulls back to area of stall2, which should be good support area - a bull flag support. But the pattern there does not look bullish. Bear candles. No attempt by bulls to break prior candle high. And you have a spike bear bar which is wider in range than the bull bars prior to the bull run ending.

Subsequent action shows the stall 2 high is now acting like resistance.

Overall bear picture. I think the bulls were happy at the high because it met some target they had and they went away for a while.
 

Attachments

  • ptternstall.jpg
    ptternstall.jpg
    43.7 KB · Views: 142
Looks bearish to me. You have 3 stalls on the way up. Price looks like it is struggling to get somewhere.

Stall 3 formed a horiz top and you could say it tried 3 times to make Hr High.

Then it pulls back to area of stall2, which should be good support area - a bull flag support. But the pattern there does not look bullish. Bear candles. No attempt by bulls to break prior candle high. And you have a spike bear bar which is wider in range than the bull bars prior to the bull run ending.

Subsequent action shows the stall 2 high is now acting like resistance.

Overall bear picture. I think the bulls were happy at the high because it met some target they had and they went away for a while.

Makes sense. I thought about it from the perspective of entering traders, but the exiting bulls will most likely be the major force here.
 
I am really glad that the market is moving again, but I'd be curious to revisit August to see if I could do better. At that time, I didn't understand IRB's at all, and that seemed to be the main tradable opportunity during that time. I skipped all of them.

I think the IRBs are pretty advanced setups and are the trickiest to spot correctly. I agree that it would be good to review August (and for that matter any month with a low VIX and low market volume) and get ideas on how to scalp with 5 pip targets. I have heard from people who've done that before, its doable. Even if its +5 / - 6 pips (-5 + commission), those kind of setups do work if you can spot them.
 
hey guys,

I just finished reading Volman's book and it was friggin excellent (alhough it took me some time). I'm having trouble understanding the ARB setup so I'll be rereading that part but hopefully I'll join you guys soon on the discussion.

I would like to ask: has anyone found an online platform with the 70tick chart, bracket orders and the possibility to draw support/resistance lines?

Thanks
 
hey guys,

I would like to ask: has anyone found an online platform with the 70tick chart, bracket orders and the possibility to draw support/resistance lines?

Thanks

I'm using ProRealTime for the 70 tick charts, and I use FastBrokers, their software is Pathfinder and it has bracket ability. Metatrader also has bracket ability. Both have drawing ability, but I do all of my drawing on ProRealTime and just use my broker's platform for executing orders.
 
I'm using ProRealTime for the 70 tick charts, and I use FastBrokers, their software is Pathfinder and it has bracket ability. Metatrader also has bracket ability. Both have drawing ability, but I do all of my drawing on ProRealTime and just use my broker's platform for executing orders.

Any chance bracket ability could be available on a free platform?
 
Yeah, MT4 does have bracket orders and it's free. You can get an MT4 demo account through a lot of different brokers. I used Oanda but it seemed to lag a little for me, although it was during a time when they were having server problems. It may be better now. I had more luck using MT4 through FXCM or Alpari.
 
BTW guys, disregard my questions about ARBs, I reread the ARB chapter today and found what I was looking for.
 
Thanks to you guys for this wonderful discussion over here from here many traders get some good information which is really helpful to them..
 
104 Skipped Trade.png

Hey guys,

I was wondering what your thoughts were on this. I decided to skip BBs in the top of a range like this, especially when lacking proper squeeze like in this chart. The issue here is that price has some support, and clearly doesn't want to drop through the 20 level here.

I didn't see validity in this setup as is. Personally, I don't think I'd take this without a couple dojis before the break. Consider this scenario: Seeing how many times price bounced around and was still able to stay above the 20 level, a couple dojis near the top barrier of the box would give a nice squeeze and look pretty bullish. I might look for a bullish break here. If that were the case, would you take it?

If you guys remember, I was doing a BB study a couple weeks ago. Previously I'd been taking BBs at the top of a range and getting stopped out regularly. However, I wasn't paying attention to 20 levels and that probably played a large role. I logged about 100 BBs into a spreadsheet and decided to abandon the study because there are so many variables involved that I can't accurately describe each setup. I think that was the point when I realized that I was giving way too much credit to the pattern itself and not conditions. So, sorry I didn't have more info about that, but I think we're headed more in the right direction now anyways.
 
Is the FOMC likely to move the market? I am not very familiar with what each news announcement means, firstly because I don't live in the US and secondly because I don't want to be fundamentally biased, so I simply don't care. But I had just one trade today and would like to trade some more.
 

Attachments

  • z1.png
    z1.png
    25.7 KB · Views: 230
  • z2.png
    z2.png
    29.4 KB · Views: 280
Is the FOMC likely to move the market? I am not very familiar with what each news announcement means, firstly because I don't live in the US and secondly because I don't want to be fundamentally biased, so I simply don't care. But I had just one trade today and would like to trade some more.

It depends. Last month price moved a lot and there were like 3 trending BBs within 20 or 30 minutes. It just depends on what they announce but I like to watch it.
 
View attachment 146484

Hey guys,

I was wondering what your thoughts were on this. I decided to skip BBs in the top of a range like this, especially when lacking proper squeeze like in this chart. The issue here is that price has some support, and clearly doesn't want to drop through the 20 level here.

I didn't see validity in this setup as is. Personally, I don't think I'd take this without a couple dojis before the break. Consider this scenario: Seeing how many times price bounced around and was still able to stay above the 20 level, a couple dojis near the top barrier of the box would give a nice squeeze and look pretty bullish. I might look for a bullish break here. If that were the case, would you take it?

I think the pressure was bullish though the bears were definitely fighting back inside that block. You're right though, there's not much of an entry but if there was I'd take it.
 

Attachments

  • USD Spot.png
    USD Spot.png
    16.9 KB · Views: 208
Last edited:
View attachment 146484

Hey guys,

I was wondering what your thoughts were on this. I decided to skip BBs in the top of a range like this, especially when lacking proper squeeze like in this chart. The issue here is that price has some support, and clearly doesn't want to drop through the 20 level here.

I didn't see validity in this setup as is. Personally, I don't think I'd take this without a couple dojis before the break. Consider this scenario: Seeing how many times price bounced around and was still able to stay above the 20 level, a couple dojis near the top barrier of the box would give a nice squeeze and look pretty bullish. I might look for a bullish break here. If that were the case, would you take it?

If you guys remember, I was doing a BB study a couple weeks ago. Previously I'd been taking BBs at the top of a range and getting stopped out regularly. However, I wasn't paying attention to 20 levels and that probably played a large role. I logged about 100 BBs into a spreadsheet and decided to abandon the study because there are so many variables involved that I can't accurately describe each setup. I think that was the point when I realized that I was giving way too much credit to the pattern itself and not conditions. So, sorry I didn't have more info about that, but I think we're headed more in the right direction now anyways.

I wouldn't trade that BB simply because of the lack of squeeze as you mentioned.
 
104 GBP Trade.png

Well, I tried to take a BB here after the FOMC minutes. Didn't work out. I'm not sure if it was too choppy or what. It was a bit messy.

Pros:
20 level support
Possible round # vacuum effect
Dojis before break
Average turned from bearish to sideways.
Pullback onto support
I thought that big bearish bar was a false low because it was immediately countered by the bulls. Then there were a bunch of bullish dojis before the break.

Cons:
Price action somewhat choppy.
Double Top, but that shouldn't pose too much of a threat to a strong BB in a pullback.
Several false breaks.

I don't know if the false breaks and choppy price action did this BB in or not. Maybe it wasn't built up well enough or maybe there was nothing wrong with it. It definitely wasn't the prettiest but it looked like price might go back and test the round #. Thoughts? Usually if a trade doesn't work out it at least goes a few pip, but since this one only went 1 pip I sort of figure it may have been a bad setup since nobody else wanted to join.
 
Last edited:
View attachment 146504

Well, I tried to take a BB here after the FOMC minutes. Didn't work out. I'm not sure if it was too choppy or what. It was a bit messy.

Pros:
20 level support
Possible round # vacuum effect
Dojis before break
Average turned from bearish to sideways.
Pullback onto support
I thought that big bearish bar was a false low because it was immediately countered by the bulls. Then there were a bunch of bullish dojis before the break.

Cons:
Price action somewhat choppy.
Double Top, but that shouldn't pose too much of a threat to a strong BB in a pullback.
Several false breaks.

I don't know if the false breaks and choppy price action did this BB in or not. Maybe it wasn't built up well enough or maybe there was nothing wrong with it. It definitely wasn't the prettiest but it looked like price might go back and test the round #. Thoughts? Usually if a trade doesn't work out it at least goes a few pip, but since this one only went 1 pip I sort of figure it may have been a bad setup since nobody else wanted to join.

Why look for long if the reaction to the news announcement was bearish?
 
Top