stehlikpetrmsncom
Active member
- Messages
- 194
- Likes
- 3
Nice to see everyone here still actively sharing ideas based on Bob's work.
Personally I've scrapped the 70 tick and am back to using Oanda's 30 second chart for what I do. My target is just to trade the NY-Europe session for 2 hrs a day so the liquidity is consistent enough overall without needing the benefit of tick's consolidation. When the market starts moving fast like it did today as it broke out of the 40 zone, I just use my judgement, and most of the time my judgement tells me to stay clear of something that is moving too quickly because the volatility jumps and stops are often taken out.
I've also found that for the life of me most of my trades never hit the 10 pip target that Bob suggests, so I've found it much better to shoot for more conservative amounts (I find that 7-9 points usually works well). Clearly we're just in a different market environment these days, though I'd say September was an improvement over August which was just total death, the market was just moving in 5's back then.
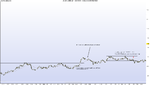
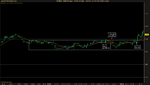
E1: I thought it was worth the risk (~5 pip stop) since the bulls couldn't follow through after prices tried to test the 20 level at around 5:33.
E2: Quickly realized I was wrong on E1 and saw that false break of the 20 as a very bullish sign for an upward break. Since the 20 level was holding strong it seemed like a good candidate for a long towards the 40. There is some resistance above from that earlier range/block but I thought there was enough tension in this range to overcome that. I was paranoid about the 40 level, probably because of yesterday where my trade soured 1 pip below the 40 level so I ended up closing my trade out early.
E3: Trap. Oh well.
M:ARB: I had to use the bathroom at the worst time 😛

I noticed your nice comments on your charts yesterday. And again today. I find them very helpful. They are very "Bob-like".My four trades today.
Thanks, I'm glad you like the notes.I noticed your nice comments on your charts yesterday. And again today. I find them very helpful. They are very "Bob-like".
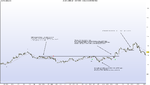
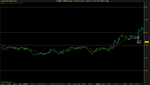
On your failed RB on 2nd chart, did you exit as soon as the bar closed beneath the ema? That is where I see Bob marks exits on charts he shares. It looks like where you'd have put your original stop too.

My concerns would be the double bottom exactly at 00 level and then subsequent higher low, it looks too bullish in my opinion. But I don't know.View attachment 146430
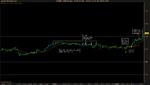
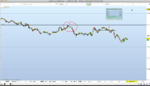
Does this trade seem too aggressive? Since I just started paying attention to price behavior near the 20 levels, I wasn't confident enough to jump into this IRB yet, but I want to make sure my analysis is on the right track. Putting conditions first feels weird at first, and almost feels like a "hunch" when the setup itself isn't quite as nice, but I'm sure that will go away when I am more confident that I'm reading conditions correctly. In this case I wanted the IRB to be a little more extended and I would've participated, but I don't know if that was necessary. My thoughts here were:
-Price fails to retest the 20 level on 2 attempts. I assumed this would mean it is likely to go down and retest the round # again.
-We have a little BB with EMA squeeze
-Trend continuation potential
Concerns?
-Round #, but it is exactly 10 pip away
What do you think?
My concerns would be the double bottom exactly at 00 level and then subsequent higher low, it looks too bullish in my opinion. But I don't know.
However, I think you shouldn't be concerned with the round number itself, quite the opposite, you should welcome it in this scenario (vacuum effect).
Good point. The double bottom did look a little sketchy. But from a bearish side we had a double top and a lower double top, and I thought that might sway things in favor of bearish. I guess that makes 4 bearish signs and 2 bullish that I can think of. I think what is scary about the double bottom is that it shows round # buying interest.
What do you think of the bear flag to the left of that setup?
To be honest I am not sure where is the bear flag, I don't see it 😀
Ditto.

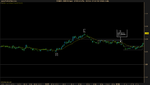
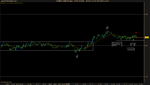
I think he's talking about this one.
I don't think I even noticed that possible setup. It looked like the market had trouble picking a direction and all I could see was resistance to any possible trade so I just watched. I did eventually get trapped when I took an impulsive trade though. I kept telling myself that I should wait for more buildup since it had to crack the 20 to the upside but when I saw the break I just immediately pressed "buy". That was stupid of me.
It's because of german bank holiday.I almost took that trade too, but stopped since it was right below the 20 level. It was kind of a weird day since it only stayed in a 20 pip range. Maybe because tomorrow is the FOMC day.