Bob Volman Price Action Scalping

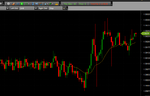
Well, I tried to take a BB here after the FOMC minutes. Didn't work out. I'm not sure if it was too choppy or what. It was a bit messy.

Usually if a trade doesn't work out it at least goes a few pip, but since this one only went 1 pip I sort of figure it may have been a bad setup since nobody else wanted to join.

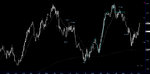
I would have waited a bit longer until the EMA gave a hint with a slope up before going long. At the time it was flat, so I'd be leaning bearish. I don't like where the BB built -- not quite at support so I'd expect it to go lower to actually test the support. I also think that may have been a reversal top that built at the 1.62 level.
 
Why look for long if the reaction to the news announcement was bearish?

That could be the reason it failed, but at that point it seemed like the news traders were gone. There wasn't a huge reaction to the news, nor a major announcement like last month. They failed to push price below the 20 level and volume had slowed back down to a normal pace, so I thought at that point it was safe to read the chart normally like any other time of day. The chart itself was bullish overall. I thought the news announcement triggered a pullback but didn't expect it to last.
 
I decided to skip BBs in the top of a range like this, especially when lacking proper squeeze like in this chart. The issue here is that price has some support, and clearly doesn't want to drop through the 20 level here.
You are right about not much double pressure. But I really like the looks of that pullback down leg. You had 2 legs down - first is complex and 2nd ends by a nice horizontal action that flattens the ema before turning up. The pullback stayed above the prior little block at the low. That would have me concerned if the horizontal action was shorter. But its length was enough to convince me price was holding steady by bulls. Then you have that nice run up out of sideways consolidation. Then the pause with 7 equal lows in the BB. Some bulls are taking profit at the prior high but not strong bears actions -- they were not waiting with baited breath to come it at the prior high.

It is an aggressive trade and didn't even give you an ARB for a second chance.
 
stehlikptr,
I thought this chart from today looked similar to your schematic from yesterday. I drew in the cyan lines to show the similarity.
I thought you might find it helpful to collect another example.
 

Attachments

  • schem-example.jpg
    schem-example.jpg
    228 KB · Views: 216
That could be the reason it failed, but at that point it seemed like the news traders were gone. There wasn't a huge reaction to the news, nor a major announcement like last month. They failed to push price below the 20 level and volume had slowed back down to a normal pace, so I thought at that point it was safe to read the chart normally like any other time of day. The chart itself was bullish overall. I thought the news announcement triggered a pullback but didn't expect it to last.

I view news announcement like this as a reset of the overall picture. You can't simply view it is as a pullback, because the activity prior to the news was very low, and the average size of pullback bar would be so much bigger then average in the "trend".

News traders usually don't really care about our scalping context and price rises or falls as it likes, sometimes it can shift the whole sentiment to the other side regardless of previous price action. After volatile news, just try to view the overall picture with new glasses.

At least that's what I do, maybe I'm wrong.
 
stehlikptr,
I thought this chart from today looked similar to your schematic from yesterday. I drew in the cyan lines to show the similarity.
I thought you might find it helpful to collect another example.

Thanks, that's a nice example. It seems some people got trapped in that pretty exemplary. If I was a countertrend trader, I'd probably try to make some setup of this pattern :)
 
@stehlikptr
Chart 1 - #2 - your read here was really good.
Chart 2 - You were very quick to see the IRB. I'd probably not have seen it and waited for the RB and taken it. After the DB in the range, hopefully the resistance of 2 would not be a problem. Looks like the dips to the ema after the 2nd bottom were pulling in bulls so bullish at the IRB as opposed to doing an IRB boomerang.
 
I view news announcement like this as a reset of the overall picture. You can't simply view it is as a pullback, because the activity prior to the news was very low, and the average size of pullback bar would be so much bigger then average in the "trend".

You're right about the size of the pullback bars, they were 2-3 times the size of the bars in the trend. Maybe the Double Top should've been given more weight in this case, but if I saw that same double top in a strong bullish trend it might not matter. Given the enthusiasm of the down trend I think I went looking for a setup too early. It's 45 minutes later and price is still holding up above that 20 level, even tested it to the pip once. Now might be a better time to look for continuation with proper buildup. Bah... Guess I'll try again tomorrow.
 
stehlikptr,
I thought this chart from today looked similar to your schematic from yesterday. I drew in the cyan lines to show the similarity.
I thought you might find it helpful to collect another example.

I'm not seeing the ARB for some reason. Can you explain it?
 
You're right about the size of the pullback bars, they were 2-3 times the size of the bars in the trend. Maybe the Double Top should've been given more weight in this case, but if I saw that same double top in a strong bullish trend it might not matter. Given the enthusiasm of the down trend I think I went looking for a setup too early. It's 45 minutes later and price is still holding up above that 20 level, even tested it to the pip once. Now might be a better time to look for continuation with proper buildup. Bah... Guess I'll try again tomorrow.

Yeah, I hope tomorrow will bring some trending action, I'd like to practice that a bit more :)
 
Guys, sorry for interrupting the setup discussions again but I'm have trouble with software. (I asked this question before but all the answers directed me towards Metatrader)

I'm looking for something that would replicate Bob's style: 70 tick chart, bracket orders and line drawing. These last two shouldn't be a problem I guess. As for the ticks, so far I've tried Oanda's web browser platform and metatrader but I'm having trouble getting the latter to display a tick chart. I've tried 2 custom made indicators that are supposed to do that but it's not working. Any other ideas? I'd very much prefer it to be free at least for a trial period in order to get a hang of the system and the setups.

You can try NinjaTrader, it's free if you want to demotrade, it has Market Replay option (although very limited), bracketing and line drawing of course.

The tick chart is problem however. You can try to log for demo account at various brokers (send mail at NT, they'll let you know which brokers they support) and then check if the tick charts are similar for example to the ones we post here.

The already mentioned Pathfinder has all the things you need, it has 30 days trial and their customer support is quick and helpful.

The ProRealTime has 7 days trial, although I understand that's probably not enough for you.
 
I'm looking for something that would replicate Bob's style: 70 tick chart, bracket orders and line drawing.
A friend uses Ninjatrader with Kinetick feed. It looks something like Bob's style. I have no idea if Kinetick offers a free trial.
 
I'm not seeing the ARB for some reason. Can you explain it?

The ARB is 1 bar only. I marked it in real time. At that point I thought the neckline to the H and S had been broken. Then you get that 2 bar pullback that tests the right shoulder and the 3 bar equal high ceiling next to it.

If I was marking up the chart "after the fact", I might not have even seen it as an ARB. Sometimes you can read the action in real-time better because the move up and down the bar while building shows the pressure/test so well.
 
Is the FOMC likely to move the market? I am not very familiar with what each news announcement means, firstly because I don't live in the US and secondly because I don't want to be fundamentally biased, so I simply don't care. But I had just one trade today and would like to trade some more.

Hi stehlikpetrmsncom,

I just re-read the RB chapter and I have a question regarding drawing range barriers. Bob wrote on page 139 that the starting point is "often a visible top or bottom from which the market clearly bounced". The ranges you drew today looked different to me from those in the book: there was usually a trend right before the range, whereas in your ranges today it wasn't clear.

Hi, I am sorry but I don't see how are they different if we're talking about the same range. There doesn't always have to be a trend before the range.
 
You can try NinjaTrader, it's free if you want to demotrade, it has Market Replay option (although very limited), bracketing and line drawing of course.

The tick chart is problem however. You can try to log for demo account at various brokers (send mail at NT, they'll let you know which brokers they support) and then check if the tick charts are similar for example to the ones we post here.

The already mentioned Pathfinder has all the things you need, it has 30 days trial and their customer support is quick and helpful.

The ProRealTime has 7 days trial, although I understand that's probably not enough for you.

Thanks for the suggestions, Pathfinder has all the requirements for Bob's method and gives a nice 30 days trial as you said. Great !
 
So right before the opening of the US market (from 7 to 8 in the morning) the chart I'm on started doing really weird stuff: extremely spiky candles.

I'm posting the charts here to verify if you guys are seeing the same thing or if my tick chart setup is screwed up.

Also, is this type of action normal at this time of day? if yes then it seems totally untradable to me.
 

Attachments

  • spiky.png
    spiky.png
    34.8 KB · Views: 262
So right before the opening of the US market (from 7 to 8 in the morning) the chart I'm on started doing really weird stuff: extremely spiky candles.

I'm posting the charts here to verify if you guys are seeing the same thing or if my tick chart setup is screwed up.

Also, is this type of action normal at this time of day? if yes then it seems totally untradable to me.

My chart was similar but mostly solid bars instead of pinbars. This morning at 8:30 ET was the unemployment rate announcement and nonfarm payrolls. Check an economic calendar, you usually want to avoid trading during the moment of the announcement. I use dailyfx's calendar, some of the others use the one at ForexFactory.
 
Top