TradeTheEasyWay
Well-known member
- Messages
- 478
- Likes
- 4
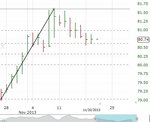
USDJPY is the best chart. I'm looking to buy 98.50 for a move into parity.
Mike
Mike
Hahahahaha ,, OR to the deep seas ????? 😆USDJPY is the best chart. I'm looking to buy 98.50 for a move into parity.
Mike
Hahahahaha ,, OR to the deep seas ????? 😆
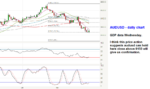
I'm looking to short any pull back around the 13480/500 area tomorrow.
Mike
what do you see in the usdjpy?
you ever watch the dollar index mike ?
Good morning to u Mike ,
I am very sorry for the late reply , as i did NOT notice ur question to me till today with the email i received .
I am more than happy to give u my take on the market action at that time of ur question which was 13/11. And i am doing it out of respect to ur request .
I am a total and full Fibonacci trader , i do NOT use any indicators , because (and for me ONLY ) , I dont need artificial light when i have the sun out . hahahaha ,, hope u dont mind the way i put things .
i believe that this market is mathematically calculated and harmonically balanced at the highest order , hence the basis of my analyses .
My analyses are based on the hourly chart. BUT i am NOT a swig trader , as i am an intra day trader and trade the 15 mnt charts , BUT i am NOT a scalper .
I will try to keep it short , BUT there is a need for the use of important foundational info in the process
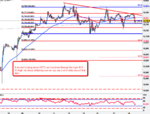
We will start at the major retracement low we had on the 7/11 as our base . which was a nicely behaved market action missing a repeat range down by 2 pips .
We get the first up range in , which sets the tone for the run to follow , and based on that first range , we get extensions to the next level , it is a MAJOR level , which came in at the high of the day on the 11/11 , price target 99.269 , and the market did pull up at 99.298 , which i can live with that , as i am sure if we zoom into the 15 mnt chart , we will see a level completing at that point ,and yes we also do have a 2618 ext. at 99.300, BUT that does NOT interest me , as my calculations are based on a different theory that i see work alot more consistent .
That becomes MY anchor level and what I call a point of balance , which will give me the foundation of what to expect next .
As u can see ,, that first small range evolved into a bigger range , and i do that because , and ONLY to MY OWN satisfaction and opinion , i have come to the belief that the market IS constructed to Fibs , and because the market is an ever evolving thing , and so do our Fibs need to be the same .
That range sets up next top , the top of the 12/11 , which is a reasonably strong Fib level that i call my first station , and also it completes what i call a cycle for me ( based on swings ) , at which i would expect a pull back , which did NOT fail us ,,, A 2 day pull back which indicates the importance of that level , and was also to a Major point that fits with my Fib extension theories .
After the retracement , We then see another evolving in the making , we see the market pushes higher , and so we follow it based on our extensions theories , and again to no surprise to me ,, we get this last top on the 15/11 with first station( on the bigger picture ) target at 100.395 ,, Actual top 100.435 , again i can live with the market to be over running a level by 4 pips over a 6 day action , and again I am sure it would be clear if we zoom in to smaller time frame to see why it had to go there.
Now that was on the big picture ,, BUT this is a daily standard routine for me on the 15 mnt chart , and i see it day in day out ,, very very powerful stuff .
I know there are NO details as to why i get these targets ,, and it is because i do NOT share my finer details in the public forum for many reasons.
Also i would like to suggest something IF I MAY ,, that u seriously look into introducing Fibs into ur trading , as they are extremely powerful and precise , as they will give u the ability to pick almost every swing top and bottom and daily tops and bottoms , IF u r an intra day trader
Cheers,
George 😎
Hello Mike ,Hi George,
Thanks for your analysis. I agree, fibs is one of my favourite tools, I use it to trade forex but I also use it in momentum trading of oil and the dow, especially on fed day. The market is ever more technical and fibs will always be a good trading 'friend' to me.
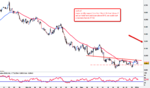
I'm hoping the usdjpy will drop to 50% - 100.60 level in the early part of the week.
Mike
Just wanted to update Mike ,Hello Mike ,
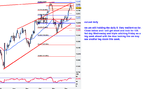
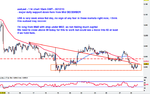
It is my pleasure ,, anytime u would like an opinion , please feel free , and i have some levels to suggest keeping an eye on IF they push up , which i can happily share with u the details , but the levels are ,,
101.56 and the double top level at 101.53
repeat range at 101.37
And 101.45
That is ON the smaller picture , BUT if they truly push up , then we need to bring in the big range up previously .
Speaking of Fibs, i would like to suggest something to u , which i do NOT wish to mention in the public forum , due to the rubbish i get bombarded with from some time wasters and negative people , so i will send it to u via pm , pls keep an eye on ur pm box .
Cheers,
George 😎
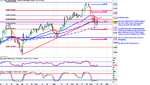
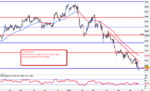
Click on the chart to see what i see in this pair.
What do you think?
Mike