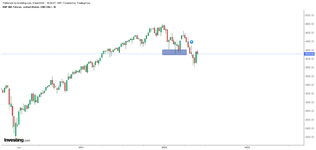
In January 2022 when the market started dropping I highlighted a few support zones where the market could potentially hold. I have highlighted these in the screenshot below. I primarily used fibonacci rectracements and projections and moving averages to come up with these zones. My question is once price approaches these key support levels is there any technical tool/technique that I can use to confirm if these areas of support will hold? I am a newbie here and I apologize if I have not followed some of the rules while making this post. Any help would be much appreciated.

You are using an out of date browser. It may not display this or other websites correctly.
You should upgrade or use an alternative browser.
You should upgrade or use an alternative browser.
your support zones as you rightly say, are simply "potential" areas
as price now approaches those areas, signs of reversal will appear on the weekly timeframe. you'll see typical reversal price patterns emerging, (H&S, double bottoms) you'll see supporting indicators now firing their signals
trend lines being broken etc
if you dont, you simply let it go, as the chance are, they weren't potential support areas at all
If price is going to rise or fall, chances are, its going to break whatever support or resistance areas you have. price i find, stalls at these areas rather than reversing
Thank you for your prompt reponse @1invest. When you say "signs of reversal will appear on the weekly timeframe", do you mean go down to a lower timeframe to determine the reversal signals? I am looking for a resource to learn more about these reversal patterns/indicators. I have gone through John Murphy's "Technical Analysis of the Financial Markets" and there is some information there. Would you have any suggestions as to where I could find information that explains reversal patterns/indicators in an approachable manner?your support zones as you rightly say, are simply "potential" areas
as price now approaches those areas, signs of reversal will appear on the weekly timeframe. you'll see typical reversal price patterns emerging, (H&S, double bottoms) you'll see supporting indicators now firing their signals
trend lines being broken etc
if you dont, you simply let it go, as the chance are, they weren't potential support areas at all
If price is going to rise or fall, chances are, its going to break whatever support or resistance areas you have. price i find, stalls at these areas rather than reversing
As you're displaying a monthly chart (and well done to you!) its not so easy to see the finer details of what price is doing. you dont need to go down to anything lower than weekly, but the recent top in SPX was highlighted more prominently within that time frameThank you for your prompt reponse @1invest. When you say "signs of reversal will appear on the weekly timeframe", do you mean go down to a lower timeframe to determine the reversal signals? I am looking for a resource to learn more about these reversal patterns/indicators. I have gone through John Murphy's "Technical Analysis of the Financial Markets" and there is some information there. Would you have any suggestions as to where I could find information that explains reversal patterns/indicators in an approachable manner?
the first higher low broken at 4500ish, and then a second previous higher low at 4300ish and then lower high at 4600
all signs of the trend changing direction
not so visible on the monthly timeframe.
so if you were looking at support on a monthly timeframe, you'd be expecting to see sign of now a higher low taking place
the book you mention, John J Murphy, yeah first book i ever bought. i look for higher highs, higher lows and vice versa. that's what defines the trend, and then breaks of them
happy to discuss more with you if you're having issues understanding
dont move away from monthly, in my opinion, but rather "supplement" with weekly which is all the detail you need
As you're displaying a monthly chart (and well done to you!) its not so easy to see the finer details of what price is doing. you dont need to go down to anything lower than weekly, but the recent top in SPX was highlighted more prominently within that time frame
the first higher low broken at 4500ish, and then a second previous higher low at 4300ish and then lower high at 4600
all signs of the trend changing direction
not so visible on the monthly timeframe.
so if you were looking at support on a monthly timeframe, you'd be expecting to see sign of now a higher low taking place
the book you mention, John J Murphy, yeah first book i ever bought. i look for higher highs, higher lows and vice versa. that's what defines the trend, and then breaks of them
happy to discuss more with you if you're having issues understanding
dont move away from monthly, in my opinion, but rather "supplement" with weekly which is all the detail you need
View attachment 318901
@1invest your explanations have been very helpful. Thank you very much. It would be really appreciated if you could provide more insights to help with my understanding. Apologies for the lengthy question in advance, but I thought I would write it all in one go rather than go back and forth.
My questions are as follows:
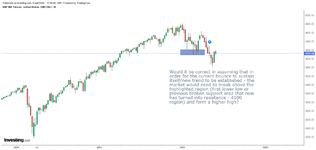
Chart 1: Would it be correct in assuming that in order for the current bounce to sustain itself/new trend to be established - the market would need to break above the highlighted region (first lower low or previous broken support area that now has turned into resistance - 4100 region) and form a higher high?

Chart: 2 & 3: I identified the levels of potential support using the following techniques. I took the fibonacci retracement from the Covid lows at 2175 (2020-03-23) to the most recent top at 4808 (2022-01-03). Areas of support according to this would show 4198 (23.6% retracement), 3816 (38.2% retracement), 3507 (50% retracement) 3198 (61.8% retracement) and the last resort 2758 (78.6% retracement).
Chart 2

Chart 3
In order to pinpoint the possible areas where this correction might end I have used the following swing points utilizing fibonacci projections. The swing points I have used are 4808 (2022-01-03), 4252 (2022-02-14) and 4631 (2022-03-28). Which gives a 100% projection at 3924 and 161.8% projection at 3487.

Chart 4
This gives me for the near future two confluence zones which could potentially act as support. The first being between 3924 - 3811 and the second being between 3499 - 3487. This area is also supported by the 21 Monthly EMA and 50 monthly EMA (I don’t have it on the charts here)

Chart 5
My ultimate question is what is the best way to confirm which of the two support levels (if any) is the market most likely to reverse from to make a new all time high? Is the only way to wait for a confirmation until the previous lower low has been broken and a higher high is formed? This would mean missing out on some of the move upwards. Or can you look at things like volume, oscillators, candlesticks, etc to give you an earlier confirmation? I have noticed that usually at market bottoms on the monthly chart the volume is usually higher than the previous months and usually the mainstream media tends to be the most bearish. Now, I have noticed both these things recently at the support zone of 3924 - 3811, but it appears most technical analysts still believe that there is a leg lower.
Finally, I would one go about actually deploying capital using these areas of support to go long. Is the only way to break the investing capital into tranches and enter into pieces once price approaches these levels? This leads to the problem of what if the market never goes down to the furthest projected support? Then you are not fully invested? Thank you once again for your guidance.

Attachments
Hey HB123, let me start with chart 1 first, where you ask about the previous low. 4200ish. we can see price reacting off it now. we dont know yet if this is going to provide any significant resistance. we may find next week storms through it to the upside. in which case its meant nothing at all
if it does go through it, does this mean we have a trend change? not at all
i want to see higher highs. and higher lows. i dont have a higher low and the last high is at 4600. Im a long way off that yet.
In other words, i have nothing in the short term to suggest a new trend change is about to begin anytime soon.
Its interesting its reacting at 4200, but nothing more than that at the moment.
does that make sense? with chart 1..
Hi 1nvest, yes that makes sense. The only question I have for chart 1 is have you highlighted the 4600 region to say that the S&P500 will need to break above previous lower high for one to say that there has been a trend change? Look forward to your comments on the other charts as well. Once again thank you so much for your input . This has been really helpful.
yep, its the last high we have. price will likely change matters as it goes about its journey, but there are only two levels we have right now to go on. and for clarity, when it says higher lows, or higher highs, we're talking about swing highs, and swing lows
ok so now going back to your questions..
chart 2, chart 3 and chart 4 are your areas that you are looking at to provide potential future support.
pesonally, i couldn't give a flying doughnut where price "may" reverse. it may, it may not. i only want to know where it does. and we will never know until after its happened. now like i say, this is your analysis, doesnt make me right or wrong. fibonacci has 4 or 5 points, thats like sticking a tail on a donkey. a 25% chance of getting it right...too arbitrary
ok moving on, you've mentioned a 21monthly ema and a 50monthly ema. interesting. never heard of the significance of those numbers. the only number im generally bothered about about is 200 day, equating to the 40week or 10 month SMA. i want to see where price is reacting to that number.
should i get a higher high (on a weekly) for example far away from the 10month, i'm likely to take it with a pinch of salt, and allocate a small part of my equity on its significance
last chart 5. you have asked..
"My ultimate question is what is the best way to confirm which of the two support levels (if any) is the market most likely to reverse from to make a new all time high?"
I've covered it in my rant above
the best way is to wait for price to made a higher swing low first. only then would i think price has made some sign of it stopping its decline. and one of your levels will likely have turned out to be correct...if its going to reverse, it will happen and the weekly timeframe will give it away soon enough.
i recommend reading a book from a guy called Stan Weinstein. profiting from bull and bear markets. he does a great job of explaining price action on the weekly. there is a thread also on the topic but i still recommend the book
given your propensity for much longer term horizons (again, i commend you) can i recommend my second favourite book called dual momentum by gary antonacci
i have both and use both when managing my own money. nothing short of fabulous in my opinion
ok so now going back to your questions..
chart 2, chart 3 and chart 4 are your areas that you are looking at to provide potential future support.
pesonally, i couldn't give a flying doughnut where price "may" reverse. it may, it may not. i only want to know where it does. and we will never know until after its happened. now like i say, this is your analysis, doesnt make me right or wrong. fibonacci has 4 or 5 points, thats like sticking a tail on a donkey. a 25% chance of getting it right...too arbitrary
ok moving on, you've mentioned a 21monthly ema and a 50monthly ema. interesting. never heard of the significance of those numbers. the only number im generally bothered about about is 200 day, equating to the 40week or 10 month SMA. i want to see where price is reacting to that number.
should i get a higher high (on a weekly) for example far away from the 10month, i'm likely to take it with a pinch of salt, and allocate a small part of my equity on its significance
last chart 5. you have asked..
"My ultimate question is what is the best way to confirm which of the two support levels (if any) is the market most likely to reverse from to make a new all time high?"
I've covered it in my rant above
the best way is to wait for price to made a higher swing low first. only then would i think price has made some sign of it stopping its decline. and one of your levels will likely have turned out to be correct...if its going to reverse, it will happen and the weekly timeframe will give it away soon enough.
i recommend reading a book from a guy called Stan Weinstein. profiting from bull and bear markets. he does a great job of explaining price action on the weekly. there is a thread also on the topic but i still recommend the book
Stan Weinstein's Stage Analysis
Quick Links: ■ Introduction (0:00) ■ Major Market Indexes – S&P 500, Nasdaq, NYSE & S&P 600 Small Caps (0:53) ■ VIX Volatility Index (5:34) ■ US Treasuries & Commodities – 7-10 Year US Treasuries, Gold, Crude Oil & Copper (6:56) ■ Sector Breadth: Percentage of Stocks Above Their 150 Day Moving...
www.trade2win.com
given your propensity for much longer term horizons (again, i commend you) can i recommend my second favourite book called dual momentum by gary antonacci
i have both and use both when managing my own money. nothing short of fabulous in my opinion
Last edited:
1nvest thank you very much for your explanation and your book suggestions. I have got myself copies of the two books that you have recommended and will be going through them. I might have some questions after I read through them which I will post here in the hopes you might be able to assist me. I would just like to say that you are an amazing asset to this forum and thank you for taking the time to educate us newbies!
you're so kind. hope you enjoy the books, and yes, please do let me know if i can help1nvest thank you very much for your explanation and your book suggestions. I have got myself copies of the two books that you have recommended and will be going through them. I might have some questions after I read through them which I will post here in the hopes you might be able to assist me. I would just like to say that you are an amazing asset to this forum and thank you for taking the time to educate us newbies!
Similar threads
- Replies
- 40
- Views
- 9K
- Replies
- 9
- Views
- 9K
- Replies
- 2
- Views
- 3K
- Replies
- 1
- Views
- 872