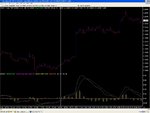
Anyone tried weird p&f on Forex?

Doctor Leo

Active member
Messages
107
Likes
7
Hello,

just to ask if anyone used p&f on Forex with 1 pip box size and 3 boxes reversal? It seems to me that on this kind of chart all TA techniques including MA, MACD (especially!) work much better than on any time-dependent ones. Any comments?
 
Hi Leo,

I just tried it and certainly do not agree with your analysis.

It looks to me like a lot of failed trades and whipsaws.

JonnyT
 
oatman said:
I couldn't figure out what he meant :confused:
Well I just tried to make a p&f chart strictly as I described and applied MACD to it. Then I looked for divergencies of MACD and the price itself and traded right after a divergence occured. Sort of swing trading - from one divergence (positive for one) to another (negative). I tried it only for a week, and I'm going to continue doing so, this week brought 62 percent to my deposit... Yet I'm not certain that I'm right so I asked if anyone tested such sort of technique.
Eh, just forgot - I use only ticks in realtime, and build p&f only on them, not any timeframe bars!
 
Hi all,,

From what I know about P&F..no you dont need a bar to generate the chart its the same as using just the closing price and using the real time ticks would be the proper way of doing it.

Regards
John
 
I used to run it on 1min Ftse future. It's not very good on Sierra but I still keep an eye ;) on it.
I preferred HILO to the Close.
 
How is this tradeable?

oatman said:
I used to run it on 1min Ftse future. It's not very good on Sierra but I still keep an eye ;) on it.
I preferred HILO to the Close.

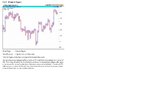
Here is an example.

Dr Leo please elaborate.

JonnyT
 

Attachments

  • PandF.JPG
    PandF.JPG
    171.6 KB · Views: 550
Bramble
Herewith definition etc of pnf from a well known and well qualified technical analyst
 

Attachments

  • UD pnf definition.doc
    68 KB · Views: 397
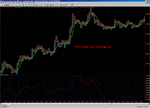
It seems to me that the most important thing is to use only tick data, for sometimes (and by me experience quite frequently) you have more than one movement within even one minute. So when using tick data for p&f charting the technical indicators appear to look smoothly. I can say it is so only on Forex as I have never seen any other market... I'll try to attach a screenshot of what I mean. It's quite classical, but it works perfect, I can just enter market right after a divergency and sit back and wait till the opposite one to come. And stragnely to say, it happens.
 

Attachments

  • div1.gif
    div1.gif
    60.7 KB · Views: 338
It is difficult to see from the image you have provided but there appears to be a linear time axis to the chart you have posted in which case it is not true pnf - Sierrachart doesn't display pnf properly and I don't think it calculates it properly either. What you said originally is true - this is weird pnf - if it works for you though then great.
 
I don't use Sierrachart, it's Omega Tradestation. The time axis is not linear in any way, say, the distance between the pair of vertical gridlines round the first peak is 10 minutes and between second pair - 20 minutes. Sometimes it's around 1 minute, sometimes - about half an hour. In fact, this is not as complicated as it seems, I just applied standard MACD to pnf tick chart... Moreover I use 8-period MA to identify where to enter the market - after the O bar crosses it for short or X-bar crosses it for long position.
 
I don't trade Forex, but I do trade stocks. And...........I do some things manually., and I'm always looking for an edge(s).

The Point & Figure Method (and the somewhat related Japanese 3 line break) have their place in trade selectiion and timing. Of course they're not preicse. They weren't designed to me. They eliminate irrelevant nosie and allow you to see the primary "trend" through the head fakes. In my humble opinion, they clearly identify the present support and reistance levels.. Since the P& F method has weathered nearly a century, there must be some merit to it. Ditto for the 3 Line break which dates to the 1600's. Floor traders seem to use it. Perhaps this is by default since they don't have ready access to computers.

In 1997 Futures magazine ran a series of interviews by a purported successful furtures trader only identtified as "Phantom". I found a great deal of guidance on several aspects of trading and HE was an advocate of point & figure.

Lastly, I don't kniow how software plaforms such as E-signal, Tradestation, MetaStock deal with P& F, but perhpas doing some things by hand at times may offer a better feel for the numbers.
 
You are right, all said above it correct and useful for classic p&f. I did learn p&f a lot and used it for a long time, but now I offer to have a different look at p&f facilities.
As to software, Omega is not good at all when making traditional p&f charts using Hi-Low, but when it's being updated tick by tick it's doing rather well.
 
Top