Just joined T2W on the back of this amusing thread- and I know i am resurrecting an old thread but, for anyone looking at this as a newbie, Dionysus is talking a bit of rubbish.
Price Action relies on Confluence. So ANY price action is only based on the 'data' you feed into it. Pin bars in the middle of a trend is not a sign of reversal. Unless you are hitting support/resistance and maybe supply and demand, but even then you need to understand the SENTIMENT behind both the move and the individual bars/formations
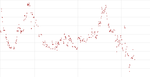
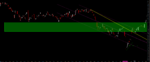
So let us look at the price action that is developing…the green bar and the 2 big red candles start the move – which in price action terms is a three outside down formation – indicating the trend is reversing/has reversed, so now it is heading downwards. It then hits some support and resistance (just need to look left on the chart to see this, so there is indecision in the market – a good push downwards, momentum is waning as people wait to see what will happen. In this example, you would not rely on the Pin bar, as it provides no sentiment in the context – it is divergent from the overall sentiment in the market (albeit a bearish pin bar). Pin bars are best used at tops and bottoms. This example is neither….. It is consolidation mode, representing a bit of indecision. Any PA trader would be mad to look at the pin bar and jump in here… unless you look slightly deeper…. Hence your next picture…
What do we have here… It’s our old friend a THREE OUTSIDE DOWN Formation… green candle up and two red candles down. Or you could even say that looking at 2 candles it is a bearish engulfing candle… HELLO!!!! Is that perhaps CONFLUENCE OF PRICE ACTION??? As I say though, there is still indecision (I believe that you have gone to a smaller timeframe, which you would have been better to go to a HIGHER timeframe to see the overview of the PA, so I would still not act off this set up…
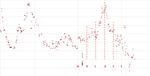
Then, we look at the No pin bar! Formation… Yep you are right, NO PIN BAR signalling a reversal, however there are more PA formations that just Pin bars that signal a change in trend (however wait a couple of sentences…) and this could be considered either a piercing line, or a bullish Inside bar.. however, when you combine the two together, what do you get… let’s look at what happens…the opening of the red candle…. A long push downwards, a long push upwards and the closing of the green candle…. Holy mother of Mary… A PIN BAR AT THE BOTTOM OF A TREND (which I could probably GUARANTEE was a S/R or S/D area. What is more, I could probably guarantee that where the trend stalls on its way up after the pin bar is at the 0.382 and 0.618 Fib retracement levels… which again gives a bigger view of the whole Price action, cyclical, structural way the market moves….
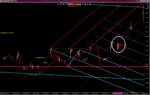
Again, on the third picture, you would not be trying to trade the pin bar that is in heavy consolidation mode, as I say, I can pretty much guarantee that the move stopped on s/r and the market is deciding which way it should go… without the ability to look left, I have no way of confirming this, but hey ho… I think the point is clear, which is this:
Looking at one set of price action in isolation is like looking at a bolt from a car and deciding form that TINY bit of information whether it will go fast or not. PA shows sentiment, and looking in isolation can tell you something, but not the whole story. If you were to base your whole trading on one single candlestick, then you will be destined to fail, as it is only as good as the bars to the left. Price action is ABSOLUTELY a leading indicator. There is a reason why they are broken up into Strong/Medium/Weak indicators for future price movements. It is based on trader Sentiment, and sentiment is based more on just a candlestick.
Even in the picture of the multiple pin bars, it does not take a genius to see the pin bars at the tops and bottoms of the RANGE are accurate – it signals a BOUNCE off the support and resistance. It shows the sentiment that for candles of the PIN bars on the bottom of the range that the sellers want the price to go lower, so price is pushed downwards, however the sentiment of the buyers who come in and bring the price back UP is stronger, signalling that the market is not prepared to go lower YET…. It could signal the start of a reversal… moving upwards, and we would assess whether the range is broken, on confirmation of price action ABOVE the range, an dno I would not have taken the last green pin bar which did lead to the breaking of the support and resistance… although the last pin bar (which is more of a hammer, not a pin bar) would probably signal the price going higher as shown and a reaction to the new SUPPORT line.
In Bars are not the be all and end all in PA, they are just a very, very small part of it, and more to the point the James 16 thread (of the small bit I have read, and seen on the other site, that again I have not looked at in about 2 years) made quite clear that it is just ONE of a multitude of different approaches.
And when he says that PA is rubbish because it changes depending on the time frame…. Obviously he has never seen a downward trend on a low timeframe, despite the higher timeframe showing an uptrend… but how can that BE?? The trend should ALWAYS be the same on ALL time frames by his rationale…
No, there are downtrends within uptrends and vice versa… and there is PA within PA.
Price Action relies on Confluence. So ANY price action is only based on the 'data' you feed into it. Pin bars in the middle of a trend is not a sign of reversal. Unless you are hitting support/resistance and maybe supply and demand, but even then you need to understand the SENTIMENT behind both the move and the individual bars/formations
So let us look at the price action that is developing…the green bar and the 2 big red candles start the move – which in price action terms is a three outside down formation – indicating the trend is reversing/has reversed, so now it is heading downwards. It then hits some support and resistance (just need to look left on the chart to see this, so there is indecision in the market – a good push downwards, momentum is waning as people wait to see what will happen. In this example, you would not rely on the Pin bar, as it provides no sentiment in the context – it is divergent from the overall sentiment in the market (albeit a bearish pin bar). Pin bars are best used at tops and bottoms. This example is neither….. It is consolidation mode, representing a bit of indecision. Any PA trader would be mad to look at the pin bar and jump in here… unless you look slightly deeper…. Hence your next picture…
What do we have here… It’s our old friend a THREE OUTSIDE DOWN Formation… green candle up and two red candles down. Or you could even say that looking at 2 candles it is a bearish engulfing candle… HELLO!!!! Is that perhaps CONFLUENCE OF PRICE ACTION??? As I say though, there is still indecision (I believe that you have gone to a smaller timeframe, which you would have been better to go to a HIGHER timeframe to see the overview of the PA, so I would still not act off this set up…
Then, we look at the No pin bar! Formation… Yep you are right, NO PIN BAR signalling a reversal, however there are more PA formations that just Pin bars that signal a change in trend (however wait a couple of sentences…) and this could be considered either a piercing line, or a bullish Inside bar.. however, when you combine the two together, what do you get… let’s look at what happens…the opening of the red candle…. A long push downwards, a long push upwards and the closing of the green candle…. Holy mother of Mary… A PIN BAR AT THE BOTTOM OF A TREND (which I could probably GUARANTEE was a S/R or S/D area. What is more, I could probably guarantee that where the trend stalls on its way up after the pin bar is at the 0.382 and 0.618 Fib retracement levels… which again gives a bigger view of the whole Price action, cyclical, structural way the market moves….
Again, on the third picture, you would not be trying to trade the pin bar that is in heavy consolidation mode, as I say, I can pretty much guarantee that the move stopped on s/r and the market is deciding which way it should go… without the ability to look left, I have no way of confirming this, but hey ho… I think the point is clear, which is this:
Looking at one set of price action in isolation is like looking at a bolt from a car and deciding form that TINY bit of information whether it will go fast or not. PA shows sentiment, and looking in isolation can tell you something, but not the whole story. If you were to base your whole trading on one single candlestick, then you will be destined to fail, as it is only as good as the bars to the left. Price action is ABSOLUTELY a leading indicator. There is a reason why they are broken up into Strong/Medium/Weak indicators for future price movements. It is based on trader Sentiment, and sentiment is based more on just a candlestick.
Even in the picture of the multiple pin bars, it does not take a genius to see the pin bars at the tops and bottoms of the RANGE are accurate – it signals a BOUNCE off the support and resistance. It shows the sentiment that for candles of the PIN bars on the bottom of the range that the sellers want the price to go lower, so price is pushed downwards, however the sentiment of the buyers who come in and bring the price back UP is stronger, signalling that the market is not prepared to go lower YET…. It could signal the start of a reversal… moving upwards, and we would assess whether the range is broken, on confirmation of price action ABOVE the range, an dno I would not have taken the last green pin bar which did lead to the breaking of the support and resistance… although the last pin bar (which is more of a hammer, not a pin bar) would probably signal the price going higher as shown and a reaction to the new SUPPORT line.
In Bars are not the be all and end all in PA, they are just a very, very small part of it, and more to the point the James 16 thread (of the small bit I have read, and seen on the other site, that again I have not looked at in about 2 years) made quite clear that it is just ONE of a multitude of different approaches.
And when he says that PA is rubbish because it changes depending on the time frame…. Obviously he has never seen a downward trend on a low timeframe, despite the higher timeframe showing an uptrend… but how can that BE?? The trend should ALWAYS be the same on ALL time frames by his rationale…
No, there are downtrends within uptrends and vice versa… and there is PA within PA.