Long_Short_Mark
Junior member
- Messages
- 21
- Likes
- 0
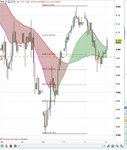
FTSE trading
Ive tried various methods including Hedjing the index using 2 accounts but this was worked for a short period in Novemeber 2012 only after I realised I had made some wrong assamptions analysing EOD figures.
Any help would be apprecaited.
Mark
Hi Mike, I'm interested in your strategy on FTSE trading.closed out for + 86,
Ive tried various methods including Hedjing the index using 2 accounts but this was worked for a short period in Novemeber 2012 only after I realised I had made some wrong assamptions analysing EOD figures.
Any help would be apprecaited.
Mark