Dick Lexic
Veteren member
- Messages
- 4,954
- Likes
- 124
the markets never cease to amaze ..s&p back at 77 sunset strip ...where else do you get **** like this? 🙂

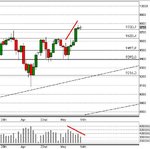
Got it wrong... last week was gold down stocks level although not by a lot …..gold still hovers around the 1292 area and a break below would be bearish ….1284/1307 break would confirm longer term upstairs downstairs imo
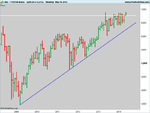
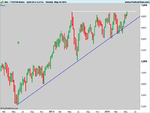
s&p 1873 cash was the area to watch last week and still is this week ...the break late last week of this area was met by a snorting bull to bring us straight back up to 1877 (broken record) ….so 1873 is critical again for me next week i'd be bearish below this level ….nasdaq100 could provide the clue if it breaks it's bull/bear level at 3595...
this bull is mad ...he eats bears 😱
all cash
am assuming same rules apply to uk and european markets as well? so will keep my eyes on these posts for updates, cheers
Just to see what peoples opinions are. Does anyone agree that the FTSE Index is due for retracement potentially back to 6500 levels. Looking at the Daily, Weekly and Monthly time frames indicated that its nearing or just touched some strong resistance points?
Any thoughts?
IMHO FTSE has a lot of catching to do ( upside ) , if i want to short an index i will choose something else , leave the FTSE alone ...
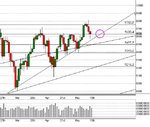
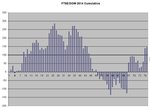
Aye, but it's been mostly trading strong this year. Chart is cumulative strength/weakness for this year, but it's not been as strong as it looks because using simple 2:1 ratio. Got to a couple of hundred strong (ie: 200+ points above where it should have been had it kept pace with DOW) before trading weak until it got to over a hundred weak before going strong again.
Im not 100% on whether Paszkman has a bearish or bullish outlook from that post but i do beleive (and correct me if im wrong) that low volume in an uptrend is a divergence and a potential bearish signal?
also paszkman is not 100% 😆
dax dropped almost 200 points from when I posted the chart the first time..
Aye, but it's been mostly trading strong this year. Chart is cumulative strength/weakness for this year, but it's not been as strong as it looks because using simple 2:1 ratio. Got to a couple of hundred strong (ie: 200+ points above where it should have been had it kept pace with DOW) before trading weak until it got to over a hundred weak before going strong again.
The Nikkei chart shows its testing 14,000 again. I'm not sure it will hold over the next few weeks...