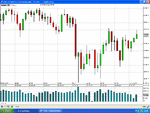
Anyone scalping the FTSE Futures??

Mark, the descending line test was a 61.8% retracement on the 5 min chart (high 5668.5, low 5629.0). After that the market didn't have an obvious target. The Italian bond auction results, I thought were ok, so I was surprised to see the big drop. I stayed out of that drop, and sat on my hands for the next 30 mins. It was tempting to get in on the break below 5629, but to me I needed to see a more steady pattern and not one that looked like a knee jerk as a result of the bond auction.

I wasn't interested in taking on the breaks of the the UBB and LBB on the 1 min chart, as it just wasn't an orderly market. I don't normally take breaks of the UBB or LBB for entries these days, although occasionally I do. I prefer to wait for a pullback to the 10 Ema or 20 Ema or MBB on the 1 min chart then enter on a stop order in the direction of the trend.

I hate buying tops or bottoms now, and have to have a good reason to do so.

I quite like trendline breaks and took a small nibble of the break above 34.5 at 11:05am, but closed soon after at 5638 when it looked to have no conviction.

Thanks to our swing trading friends, I pay a lot more attention to the 1 hour chart than I used to, and I also focus on the fib retracements and extensions on the 1 hour too. I also look to see where the next 1 hour candle starts and if it is likely to break the range of the prior 1 hour candle.

I think the market must have expected the results to be as good as yesterdays. So maybe a bit overpriced, but the bid/cover was not that great even with slightly better yields on the shorter debt.

With the Bollinger's I was talking about when we are range bound, not trending up or down.

Yes the 1 hour is my chart of choice for the fibs, they just work so well. Great for taking profits from them too.

You still think the UofM will be good?
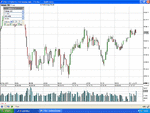
Yes, if we are clearly range bound I will still sell the UBB and buy the LBB on the 1 min chart with a 3 to 4 pt stop.

As for the U of Michegan number, they are forecasting 71.2. I think it will come in around 71 to 73. The previous number was revised up from 67.7 to 69.9.

The italian bond auction results weren't as good as yesterday, but they weren't so soft that the market should retrace instantly from 61.8% to 0% in one go. I guess the market wanted to go down any way.
 
Nice trading J. What made you enter the short at the high at the open? I went short at 8:03am on the break below 56, but my target didn't get hit and I ended up scratching for -3.5 pts at 8:05am. I then treated it as a wicks and tails market and sat it out until the ascending triangle became clear, and then I just waited for the break of that triangle.

I didn't take the short at the 61.8% retracement, although in hindsight it is clear I should have. I didn't know what was going to happen when the imminent italian auction results were released, so I was staying out until after they were released.

S&P at key resistance.. has way overextended its value areas (see post earlier this morning) market kept testing highs and failing.. holiday on Monday... SS day... time to take profits.... low risk because stop just above high... also strong divergence on MACD and MFI.... also currencies hitting major levels for turning... therefore assumprion was down.. just needed price action to confirm
 
S&P at key resistance.. has way overextended its value areas (see post earlier this morning) market kept testing highs and failing.. holiday on Monday... SS day... time to take profits.... low risk because stop just above high... also strong divergence on MACD and MFI.... also currencies hitting major levels for turning... therefore assumprion was down.. just needed price action to confirm

p.s I aint looking for big puh downwards.. so not letting these run for very long..
 
S&P at key resistance.. has way overextended its value areas (see post earlier this morning) market kept testing highs and failing.. holiday on Monday... SS day... time to take profits.... low risk because stop just above high... also strong divergence on MACD and MFI.... also currencies hitting major levels for turning... therefore assumprion was down.. just needed price action to confirm

You still setting up a project room?
 
Where's your entry? At the line or after it touches and starts a new 5 min candle and breaks lower by 1 tick? As far as I can tell it didn't make it to the line, so maybe there wouldn't have been an obvious entry.

Martin .. see the post after this .. it did break down after the alternative swing I gave...
 
Dick what platform was you using to get the volume?

i use the free charts at Ftse 100 Chart - Stock Market Live Chart
a lot of folks say they are crap but i have found them to be ok ....i don't need detailed volume in my trading. the funny thing is they have forex volume check it out

hear is the daily showing the volume yesterday.
 

Attachments

  • vol.gif
    vol.gif
    42.2 KB · Views: 136
i just checked out the weekly volume again but it looks very different now
must have been a glitch in their system.....dj do your charts still confirm this volume?
 

Attachments

  • w.gif
    w.gif
    39.4 KB · Views: 125
i use the free charts at Ftse 100 Chart - Stock Market Live Chart
a lot of folks say they are crap but i have found them to be ok ....i don't need detailed volume in my trading. the funny thing is they have forex volume check it out

hear is the daily showing the volume yesterday.

Going by the closing value on the last bar this is the cash market. But the value for the volume is strange and does not look correct. I may be wrong, but I have no idea what those values are showing.
 
What is the point of saying several countries will get downgraded today. Then every 15 mins telling us a country that will not be downgraded.

Do we have to work out the list for ourselves by elimination?
 
What is the point of saying several countries will get downgraded today. Then every 15 mins telling us a country that will not be downgraded.

Do we have to work out the list for ourselves by elimination?

trying to reconcile newsflow to price action will send you mad Reska... and all the bull**** that they put out.... all designed to throw you off your game :rolleyes:
 
Top