DaddyJohn
Experienced member
- Messages
- 1,375
- Likes
- 9
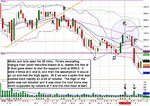
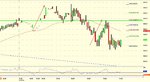
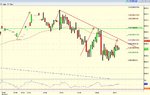
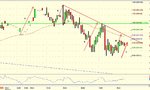
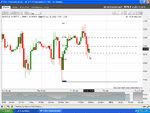
ES has a problem though ... in terms of market profile.. it now has a gap between 1278 and 1282... what I mean by a gap is that everyday you can look at where 70% of the volume actually traded (I use USA cash hours to calculate this) I then get a high and a low.. these "value areas" usually overlap , or stack on top of each other. Occassionally you get a gap in these value areas.. which is a very bullish sign.. but the market will usually come down to print more volume as these levels to complete the auction process i.e the prices are properly tested.. you usually see these areas as consolidations on your charts.