Well done... this is the first step.
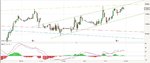
Please tell me which one is support and which one resistance? I guess you have two red lines on chart
The lower red line is support and upper one is resistance?
Well done... this is the first step.
Please tell me which one is support and which one resistance? I guess you have two red lines on chart
The lower red line is support and upper one is resistance?
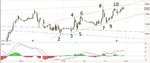
Now look at this attached chart.. 1hr time period... see the green lines. Ignore the other lines (yellow, red and blue)..
Upper green line is resistance and lower green line is support IN 1 HOUR TIME PERIOD...
Now you can see your support and resistance line is WEAK and chances that prices will regards those lines are petty weak ... WHY?
Now look at this chart and think....whats happening...
Fine.. look at the attached chart again....
to make a support/resistance line your should connect immediate Peaks and troughs ... at least last two Peaks and troughs .... that can give you rising or inclining or flat trend... a trend line can be support/resistance...
that tells you each time price touch that line price reacts up or down....
price is like a rubber it stretches far away but always LIKE to comeback. AS you can see prices are coming back but each time higher than the previous one... so up trend....
see that number 1, 4,6,8 and 10 in chart... each time price touched that line came back to bottom green line... now price is at upper green line near 10... since 5 time price touched that line and came back the chances that price will again come back to bottom green line is pretty strong... the more number of touch and reaction the more strong support/resistance....
Same at the bottom line, see the number 2,3,5,7,9.... 5 times price touched that line bounced back... that line is pretty strong as well...
so if price is at top green line , looking into the probability I would short and expect price to go back and touch the bottom green line... that's my target...
What happens NEXT
price may continue in the same channel for some time or break the channel and change the trend....
when that happens wait for some time and let price establish a new trend and trade again.....
hope that helps
I draw the lines the same way you have - It makes so much more sense now. I used to use horizontal lines for finding support and resistance levels based on previous highs/lows on the chart and it was a guessing game? So I have understood support and resistance levels bit wrong or the way I should define them? :/ hmm
Thanks a lot Jessi - I'll read and go through 2-3 times your picture and texts and hope to see and understand it well. Good night and hear about tomorrow
Jessi
Very informative !!!
Guys if you don't mind can you please tell me which platform do you use for trading? Do you use spread betting ? Or something else?
Thanks
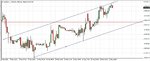
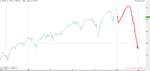
Now coming to your question if price will come back to 17500.. see the attached daily chart...
see the blue line.. that line is very tough line... and its hard nut to break...that's about 2 months of price consolidation and price broke up and tested again on 9th Feb and bounced back up side...
in order to arrive at 17500... dow needs to break many intraday and daily support... which may be possible but looks hard now.
My expectation is price is heading to 18500/18600 in next 1 month or so....
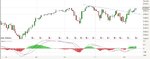
I rarely draw lines to the right of my chart but heres the last one I did. Its from 5th January.
http://www.trade2win.com/boards/indices/120172-anyone-scalping-ftse-futures-5903.html#post2465332
Is everyone ready?
Its shaping up quite well so far. 😉
10890-10910 is buying area on DAX and 18000-18200 sell area in DOW...