Dick Lexic
Veteren member
- Messages
- 4,954
- Likes
- 124
940 before the close?
That's interesting, Martin - it's basically what I do with the pair trade 'cept I'm assuming a drift back, so I'm going against the direction (of the drift - not the FTSE) rather than with it.
Not sure what the futures FTSE/ES action looked like but if you look at you superimposed action there should be a widening drift from around 14:50 which is now closing. The "difference" didn't get enough for me to trade tho.
Jon, I've only taken the trade in the direction of the drift away, but you are right. It is effectively what you do. I just think it becomes exaggerated from about 4:20pm onwards, and I guess you could trade the drift back after 4:30pm, but the difference has to be pronounced. At the moment the FTSE has lagged the ES, as you say.
martin
Today ftse opened flat vs dow
went + 10 strong in first hour - ie: dow went +38 (=19 for ftse) and ftse went +29
for the next 6 hours and some it stayed fairly flat - not more than + 5
then from 14:45 it went - 16 weak into the close
by the close the day's difference netted off around a big fat zero
I think you're right about the closing period drift - from 4:20 maybe as traders close their books for the day, but also from 4:00 on when ftse has been trading particularly strong or weak during the day.
So I suppose the biggest drift would come from when those two factors combine - eg: ftse strongly up during the day and having traded very strong vs dow when you'll maybe get some rebalancing from 4:00 added to by profit taking later on.
jon
Jon, do you have your charts set up to show the difference as an indicator? I think it would be fairly easy to set up on OEC's platform. When I get a moment I will try and set it up. Maybe a spreadbetting platform already has this.
I think someone said IG do a ftse/dow difference chart - I just do it manually with numbers.
IG charts the difference between the two, so 7000 odd at the moment.
But as they both go up, the difference will always increase.
I think what Jon does is records how they change from set time points during the day, correct me if I am wrong. How regularly do you check?
Could use DDE and use excel to do all the work for you.
I have been paper trading the FTSE Futures for over a year now, with occasional trades live. I would like to find other FTSE Futures Traders and compare notes.
I am consistently profitable on the Sim, averaging £400 per day allowing for commissions, but to achieve this I am doing 30+ trades per day. I trade one contract only, but add more if a trend continues. My average winner is £35 and my average loser is £20. My win/loss ratio is roughly 60% winners, 40% losers.
I am a very short term trader with most trades lasting 2 to 9 minutes.
My price targets are 6 to 10 points, depending on the price action.
My stops are usually 4.5 points if entered on a limit order, or 5 pts if on a stop order.
I use direct market access trading using the Open ECry platform. You get filled at the bid or the ask, and there is no spread to pay. Most people in the UK seem to use spreadbetting to trade the FTSE cash. They pay a minimum of 0.5 points per side in spread, which costs them £10 per trade, which makes it much harder to make a profit when you are scalping. My fees are £1.81 per trade.
As for strategy, I trade reversals, continuations, pullbacks and breakouts.
With the FTSE, a 2 point move above or below the previous 5 minute candle is significant enough to signal a change of trend most of the time.
I use support and resistance from the 60 minute and daily charts, and watch the 5 min, 1 min and 50 volume charts all the time.
As soon as a reversal is in, I look for retracements to the 38%, 50% and 61.8% levels.
I don't use pivots, but I make a rough note of where they are. They work better for swing trades, and are less accurate for scalping.
A 2 point move away from a S/R or fib level is enough for me to consider a change of trend.
I use the 5 min chart to monitor trends and the 1 minute chart to time my entries.
I watch how price action moves between upper, middle and lower boly bands on the 5 min chart, to decide my bias. This mid line is critical. Below mid bb, take short entries only. Above mid bb, take longs only, unless it bounces off a strong level. Importantly, I use an 8 period setting for bolys on the 5 min chart.
Pullbacks to the 5 EMA on the 5 min chart are good entries for a steady trending market.
Pullbacks to the 5 EMA on the 1 min chart are good entries in rapidly falling/rising markets.
I trade from 8am to 11am usually, and 2:30pm to 4:15pm, UK time. In the morning, I watch the ES and FESX for confirmation of moves by the FTSE. In the afternoon, I watch the ES for trend but trade the FTSE depending on what happens with the ES.
I am trying to reduce the number of trades I take, and cherry pick which trades to take. I also and trying to run my trades longer, but when I get 10 points up I usually close and bank the profit.
I am interested to see how many others scalp the FTSE futures like me, and if they are comfortable taking so many trades in a day. Also what set ups do they use that are successful.
the way i see it the cash gapped up, closed the gap and doesnt know what to do now.
if new lows are made then reluctantly shorts would be the way to go, however a re test of the highs is what i am løooking for..
doesnt seem to want to go back up though.
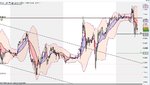
someone asked me about the pivots on my hourly chart yesterday edit ..( just noticed thats a 15 min attached but the pivot is the same)
Have a look at the chart attached - seemed to work this morning.
Oh dear 😈😈😈
Late on parade this morning and just got switched on before 8:30. Without looking much promptly went long ftse assuming 8:30 reversal. Took fright when the attempt seemed to fail and hedged with dow. Standard stuff so far, until I saw my account clocking up red, red, red - I'd damn well entered a full position on dow instead of half. Corrected it now, but it's a bit of a hit.
Someone was me. I was just giving you a heads up. Calculate the pivots and you will see they are incorrect.
Hi Martin
May i ask if your system has developed since this initial post, are the trades more cherry picked and are yopu doing less of them?
is it still as profitable for you?
Thanks
Chalky
(If you have already answered this or a similar question on the threrad then can you point me to the answer as theres too much to read through the whole lot)