Anybody got an up to date JPMVXYG7 chart?

random12345

Established member
Messages
793
Likes
280
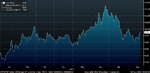
I normally only get to see a quote for this index whenever a piece is written on it in the FX media since as far as I know it's only available on Bloomberg Professional, which I have basically zero need for. I don't suppose a kind soul has access to the 2013 chart thus far to save me two grand....? :love::love:
 
Its a long shot, check the text in the recommendation to your post.
Might have some luck there - works for an IB, can't hurt to ask?
 
Enjoy
 

Attachments

  • JPMVXYG7.jpg
    JPMVXYG7.jpg
    130.4 KB · Views: 443
Spooky, I suggested he ask you, looks like I guessed right :)
 
Ha, good guess, indeed... I wondered, but couldn't find a way to see what you suggested.

I remembered you worked for an IB, most have bloomberg or reuters terminals,
so it was just a punt, I put your profile link in the recommendation text to
randoms first post :)
Good of you to pop the chart up as well :)
 
Bit of a long shot, does anybody know the calculation for
the JPMVXYG7 chart Martinghoul posted?
I'm guessing it isn't simplistic, but worth asking maybe?
More than likely its proprietary and kept under wraps.
 

Attachments

  • 165478d1377021809-anybody-got-up-date-jpmvxyg7-chart-jpmvxyg7.jpg
    165478d1377021809-anybody-got-up-date-jpmvxyg7-chart-jpmvxyg7.jpg
    130.4 KB · Views: 229
Bit of a long shot, does anybody know the calculation for
the JPMVXYG7 chart Martinghoul posted?
I'm guessing it isn't simplistic, but worth asking maybe?
More than likely its proprietary and kept under wraps.

I was unable to locate the specification and weight analysis for the index.

I was thinking about this based on my own observations and also your own recent data mining and to me, it LOOKS like it favours EOD data to establish volatility as the August reading is relatively high and though intraday August was quite dull, it did have a number of 1+% days on the G-7 pairs.

I think your own approach would be more useful to intraday traders.
 
It doesn't look that difficult as long as you have access to VIX data and futures:

http://www.sec.gov/Archives/edgar/data/19617/000095010313000005/crt_dp35194-fwp.pdf

(I couldn't open that Risk article, apologies if this just replicates).
The index that is being discussed here doesn't actually have anything to do with the VIX and is very different to the one described in the link you've provided. If you google the title of the Risk article and access it through the google search results, you should be able to see it. According to the article, the construction of it should be relatively clear, although it would be somewhat difficult to replicate without the appropriate ATM vol data.
 
Top