thanks guys
🙂
davidnorman,
Yes, I'm using sharescope realtime. I think it's ok, but a little bit expensive. Actually I didn't get round to it yet, but Dave (Euro_d) is using prorealtime and he's very happy with it, and it is cheaper (may be you could give us a review Dave).
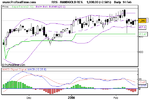
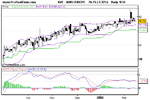
I was going to post at the beginning of the day the shares in my watchlist, but the problem is that they're too many. I usually run a filter in the evening checking for prices that closed near the 12ema. From these I then check the daily charts to see where they are in terms of support and resistance. First I look at at 6 month chart, where I plot the 12, 50 and 200 ema. (At the moment I'm using candlesticks). Then I check a longer term chart, and I go as far as it seems necessary to find historical s/r levels (just to know where they are). I also check a 10day line chart. (Actually, I do this before checking the daily chart I think...). If the 10 day chart prints s/r levels that seem to be very clear, and the price is going towards one of those, I keep it in the watchlist. The following day I look at the open, and I plot in the daily chart standard pivots, and previous day's close, high and low. Then I look for the ones that open near or above yesterday's close. For the moment that is the kind of thing I'm looking at in the morning. I forgot to say that after checking the things I had in my watchlist, I look at the whole FTSE350. It sounds like a lot, but actually after discarding the ones with crazy spreads that show bad liquidity, they're not so many. This is the feature I like about sharescope, and is that you can list this very easily and then navigate the list really quickly. But I have the feeling that I am paying this feature a little bit too expensive...
🙂 Ok, I just pass almost everything. But I check the ones that had been going down during the morning (at the moment I am only playing the long side), and that seem to have broken the downtrend. Then I check the 10day chart and 3month chart to check if there is a reason for the slowing down. (That was the case with the CNE trade). I also found very helpful to check the average true range over 14 periods in the daily chart, just to keep my feet on the ground about how far the price can go. And I also check how much of the ATR has been 'used up' to know what to expect. Oh, and something really important that I base my decision of either taking the trade or I pass it, is how much I am going to lose if I am wrong. (Sometimes it is annoying to have this rule around because many of these moves are great, but I am just not ready for them. May be one day!
🙂 ) If I can't find a stop loss that makes me feel comfortable with the trade, I pass it.
I hope this is not too confusing...By the way, there is lots of rubbish in my watchlist, and I think that sometimes I just get a lucky day
😉 I am just starting with daytrading, so there is going to be lots of improvement on my filtering I hope, at the moment I am not very efficient
🙂 I just take this filtering as a place to start rather than taking it as an absolute formula for winners, which I don't think it exists by the way...
(wow, look how long this post became! You see, that's what happens when Silvia is feeling lucky. Next time you might consider asking questions in my unlucky days...
😉 )
Good trading, and I hope my post helps.
Silvia.
(by the way, prorealtime has free eod software. You can find it here:
www.prorealtime.com )