A Professional Approach to Trading Futures

Hi Steve
Interesting to start (properly) reading your thread and your analysis. Always interested in seeing that 10 traders look at the same asset and there are 11 opinions 🙂

On the MES i had 2 strikes (1 small loss and 1 win)

Going to try and download your thread as a file and read on paper (still old school on reading)

Thanks
 
Hello

I hope you are able to find something useful in my posts
Let me know of any questions and I will try to help (if possible)

Good Luck
 
Good Morning London & Euro Traders
It is about 11am in The City

Weekly Prep Part 1 Recap of the Front Half of the Week

This is our Recap of the Weekly Price action
It is divided into a "Front Half" and a "Back Half"
Professionals organize these weekly charts so that they present
an opportunity to identify re-occurring patterns, and once
this becomes apparent and identifiable, they can anticipate
and trade successive days with confidence.

From this chart we also evaluate price action, for example in the chart
below you may notice that price is moved down strongly, to a point
where buyers (buy volume) comes in. This is standard in the industry
and is to be expected. The old descriptors are "Pump & Dump" or
(conversely) "Dump & Pump"

There is a lot to learn here, if one were to take the time to investigate
they would at some point see that there is a structure and a logic that goes with
that structure. Traders who learn this, have an edge that is durable because it is
based on behavior, rather than popularized indicators or Internet gurus.
Our analysis is taken from an approach called "Adaptive Markets Hypothesis"

We attach the chart below (Part 1 of 2)

Now we will see if anyone sees the potential

Good luck
 

Attachments

  • Weekly Cycle Front Half Example.PNG
    Weekly Cycle Front Half Example.PNG
    154.9 KB · Views: 26
Last edited:
And for this chart we add Volume Profiles for each day

Readers should now see a pattern that is consistent
with "Trading Range" behavior, and the size of the range
is significant. Institutions like this type of behavior because
they can make money on the buy side AND the sell side

If there is interest we can discuss further, otherwise we will
assume this is well known

Good luck
 

Attachments

  • Weekly Cycle Front Half Example.PNG
    Weekly Cycle Front Half Example.PNG
    156.5 KB · Views: 20
Good Morning London & Euro Traders
It is 10:26 in The City

This is part 2 of our Weekly Preparation
Process. We divide the week into 2 parts
Monday to Wednesday, and Wednesday to Friday
Monday's range creates an "Initial Balance" and a Template
that an be used throughout the week

On this chart we add Anchored VWAP. Using this tool, and with
benefit of simple analysis, we look for evidence of repetitive behavior
(Trending or Trading Range, Tests of Previous levels of Support & Resistance
and Important Price Levels). Our goal is to identify prices where buyers
or sellers react, or are forced to react (because they are trapped).

Conclusion

From our analysis to date, we know that institutions have moved the markets
lower, and then, trapped them at specific prices, to force them to "give up"
and reverse, creating a continuation of the trend higher. The trend however is
getting to be "overbought" and we think that in the near future it will pullback
and even reverse if economic conditions in the US and Euro countries deteriorate.

The final step is creation of a trading plan. We have covered this step in
previous posts

Good Luck
 

Attachments

  • Weekly Cycle Back Half Example.PNG
    Weekly Cycle Back Half Example.PNG
    169.3 KB · Views: 14
Last edited:
I received several interesting questions about "Anchored VWAP". I have been using it for
quite a long time, and originally it was software that I wrote for a different platform
I like a book by Brian Shannon whose title is "Maximum Trading Gains with Anchored
VWAP" written in 2023

As regards the use of Anchored VWAP on my weekly chart, the bottom line is that most of the
prices are above the lines (all of them) and that of itself, suggests that participants who bought
this week are currently "in the money" while sellers who took short positions this week are less
fortunate and might be either trapped short or have negative VAR positions.

For those who have an interest in becoming "informed", you should know that professionals have
access to imbalance information by way of periodic messaging from the exchanges during Asia, London
and finally, right before the US open. I doubt anyone here has the money to pay for that service however
the institutions do, and they use that data to decide how to structure their buys and sells at the formal
open. I cover this subject in my class.

Good Luck
 
Last edited:
Posting this at 2am London Time so that traders who follow the London
and NY Sessions of the S&P 500 Futures can review and react when they start
their day.

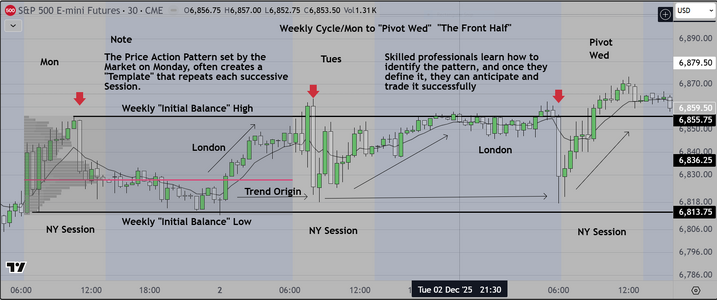
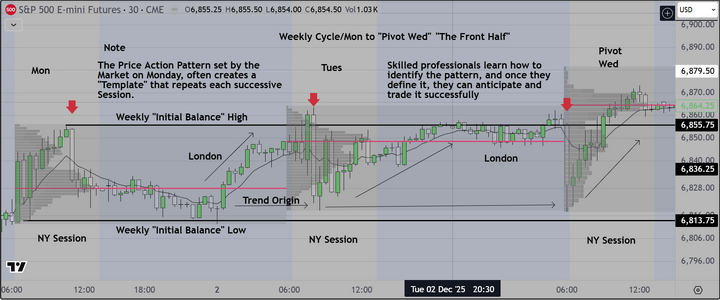
Here is an example of the preliminary prediction we provide for students, for the coming week
----------------------------------------------------

The E-Mini S&P 500 Future continuous contract is currently trading around $6,879.50, having closed the previous week with modest gains. Here's a breakdown of what to expect:
  • Consolidation: The primary driver for muted action is the lack of major economic reports scheduled for release on Monday, December 8. The significant events, including the US Consumer Inflation Expectations and the Federal Reserve's rate decision, are later in the week. This typically leads to a "wait-and-see" approach from institutional investors, keeping the price in a relatively tight range.
  • Lack of Overnight Volatility: Overnight futures action has been little changed, with S&P 500 futures inching only slightly higher on Sunday evening after the major indexes logged their second straight weekly gain. This continuation of stability suggests no major surprises over the weekend that would trigger a gap open or significant directional bias.
  • Technical Levels: The market has strong support and resistance levels from last week's trading range of approximately $6,856.75 to $6,905.00. Traders should look for the open to respect these boundaries unless new, unexpected information emerges
Important note
  • Potential for Intraday Swings: While the open might be quiet, as the day progresses, we could see typical intraday volatility as participants jockey for position ahead of the week's key risk events. Watch for potential quick moves if any minor news crosses the wire or large orders are executed in low volume periods.

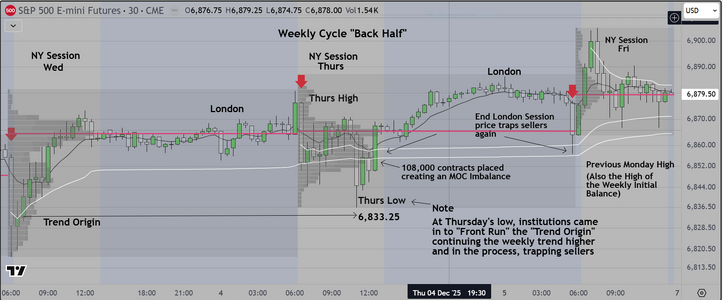
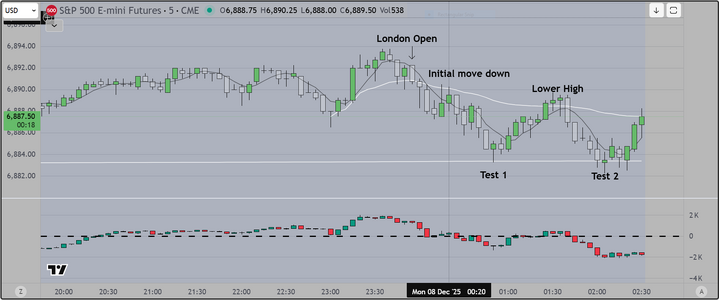
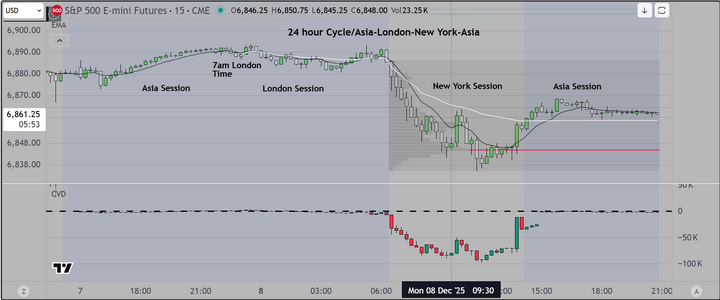
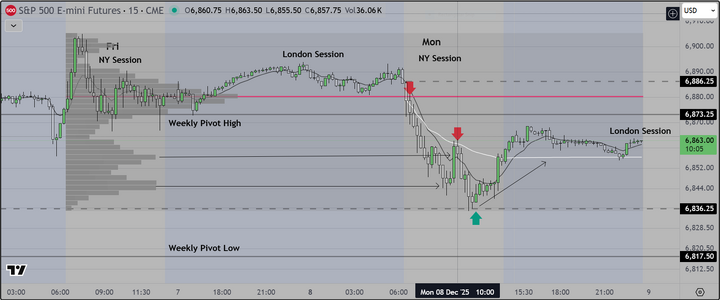
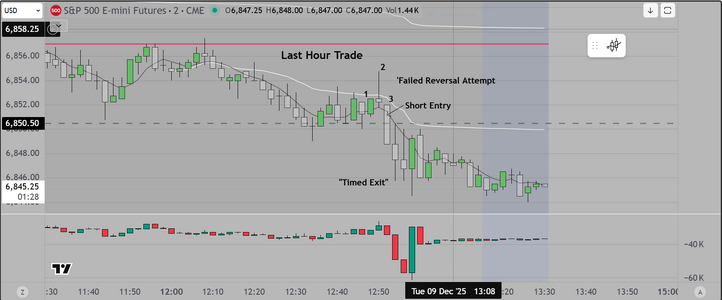
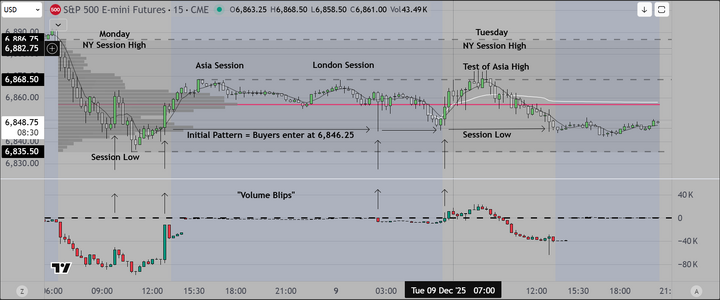
Previous price action (New York Session) is characterized as follows

1) Trading Range Open (overlapping candles with prominent tails).

2) Breaking our of the range (lower) first to Test a Key Reference (Previous Charts Identify "Key References")

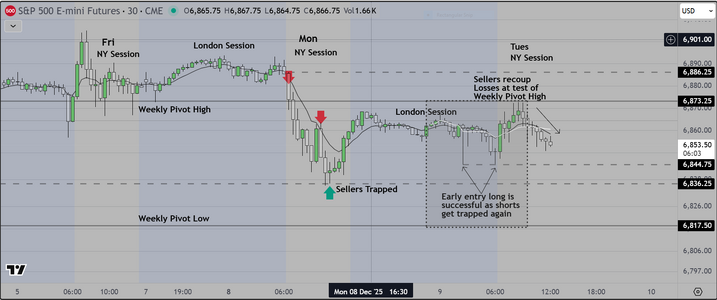
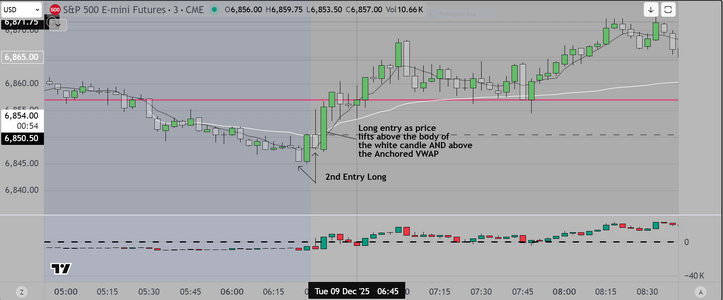
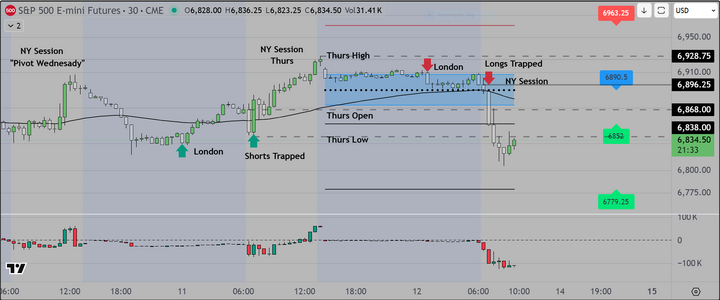
3) At each Downside "Test" Institutions came in to buy (with increased volume) trapping sellers.

4) Buyers remain "in control" currently. Mobilizing significant "buy volume" at critical Downside tests.

5) Institutional Sellers have been unwilling to commit enough sell volume to offset buyers

PREDICTION

Until we see more "high impact" economic news, we expect previous pattern to continue.
 
Last edited:
Here is a markup of the London Open

Notice the pattern. Initial move lower, followed by two (2) reversal attempts higher

The important lesson to learn are that skilled traders can make money both ways
in most market conditions (and they do). The way they do that is to understand
the underlying (repetitive) patterns, THEN to anticipate the repetition, to identify
the setups and to structure the trades to fit the conditions (these were "scalps")
If you read the previous comment, you might notice that we suggest that London
and New York are likely to be less volatile (smaller range) therefore traders will be
scalping, until later in the session or upon release of new economic or world news.

On the attached chart, look at how price bounces off the Anchored VWAP. Do you think
that is coincidence. Hardly, it is the result of algos activated by computer programs that
monitor these tools. Commercial traders from smaller firms know this and they follow along
taking scalp trades while they wait.

From a strategic standpoint it is often the case that professionals will monitor and evaluate
price action on a Monday, then make their REAL decisions as to market direction based on
what they see, and what they hear regarding news. This is practice is how the term ("whisper number")
came into common use in professional circles.


Good luck
 

Attachments

  • London Session Dec 8.PNG
    London Session Dec 8.PNG
    93.9 KB · Views: 10
I received an interesting question regarding the importance of how charts are displayed.

Turns out that HOW the data is displayed is critical. The trader needs to have two (2) "views"
of the data, one that shows a higher time frame (I choose 15 minutes), and to identify setups,
as shorter time frame, that will depend on the time of day (session time).

For my work I choose either a chart with 2 or 3 minute candles for trades taken during the first 30 minutes
I define trend or trading range using the 15 minute chart, and identify setups on the shorter time frame chart.
This allows me to make better decisions regarding early price action, then if/when the market breaks out higher
or lower, I can see it quickly and choose setups that are aligned with that trend.

The attached chart shows 15 minute candles and extends from the Asia Session through a 24 hour cycle
 

Attachments

  • 15 Minute Daily Cycle.PNG
    15 Minute Daily Cycle.PNG
    106.1 KB · Views: 4
Last edited:
This is our preliminary comment for tomorrow's New York Session of the S&P 500 Futures

Economic News Prior to, (and after) the Open
  • Lack of Pre-Market Economic Data: There are no high-impact economic reports scheduled before the New York open. The main report of the day, the JOLTS Job Openings, is a moderately high-impact report released at 10:00 AM EST, which could cause a brief reaction.
  • Technical Levels: The S&P 500 is currently near record highs, with technical resistance around 6,900 and strong support at the 6,800-6,820 levels. The market may trade within this range as it awaits a catalyst for a decisive breakout.
  • "Wait and See" Mode: General market sentiment suggests a "wait and see" approach for the first half of the week due to the high-stakes Fed meeting and upcoming key corporate earnings reports (Oracle, Broadcom).
In summary, expect limited major directional movement early in the session, with potential for some volatility around the 10:00 AM EST JOLTS release, as the market builds anticipation for Wednesday's main event.
 
And our Weekly Cycle Chart which shows the "Back Half" (Wed through Friday),
advanced by one day (showing Monday's price action).

As can be seen, the S&P 500 Futures Market has been exhibiting "Trading Range"
Behavior and the pattern seems to be an early move down to test a "Key Reference"
then a reversal, trapping sellers.

As mentioned, professionals know that they can make money on both sides of a Trading
Range. Institutions simply wait for price to "come back" to them, and they structure trades
with that in mind. We are all looking at the same charts, so there are no secrets. Once you
see the pattern and map it out, it becomes clear how it all works. The difficulty is identifying
WHEN the reversals are going to happen (during which session).
 

Attachments

  • Weekly Cycle Dec 8.PNG
    Weekly Cycle Dec 8.PNG
    121.9 KB · Views: 3
Last edited:
Back
Top