A Professional Approach to Trading Futures

Hello Everyone

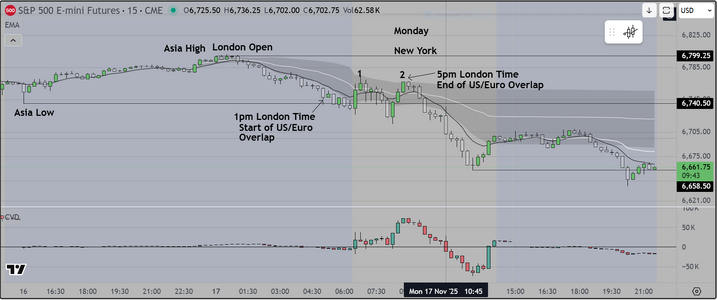
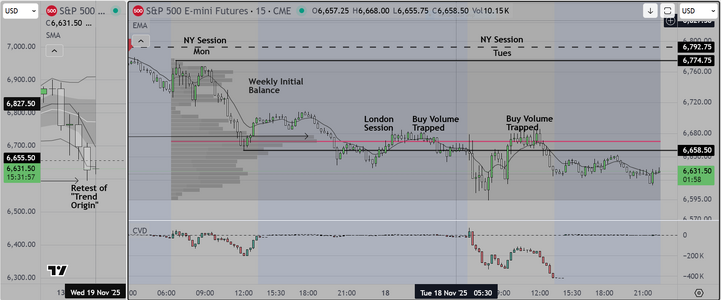
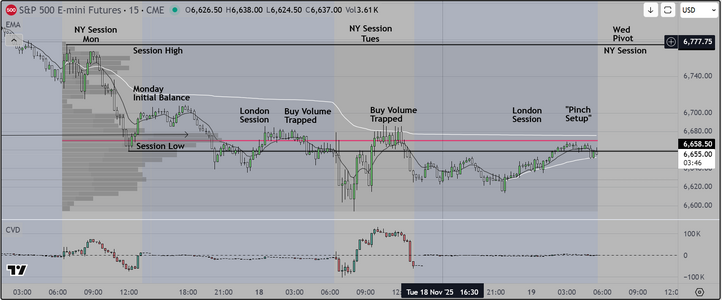
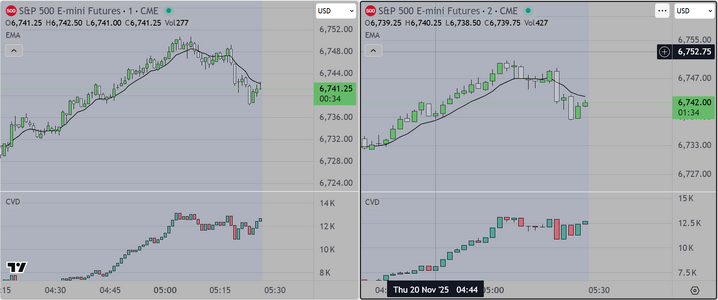
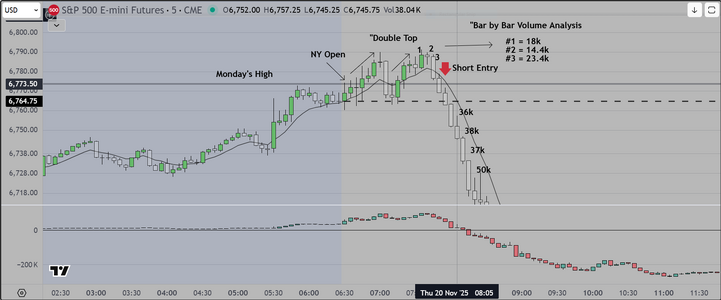
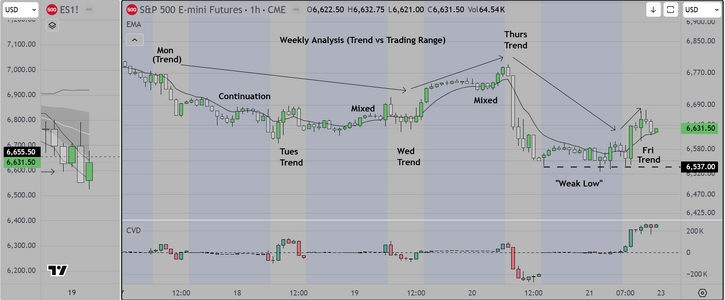
Here is a "Market Recap" chart showing the price action from the previous sessions
It starts with Asia, moving to London, and finally to NY session. It covers the ES/Euro
"Overlap" period which is what most professionals choose to trade, because of the
opportunities it can provide.

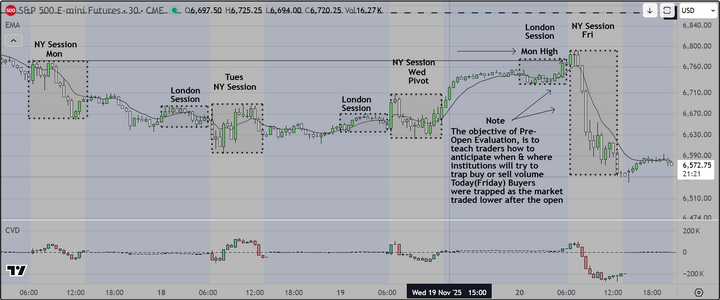
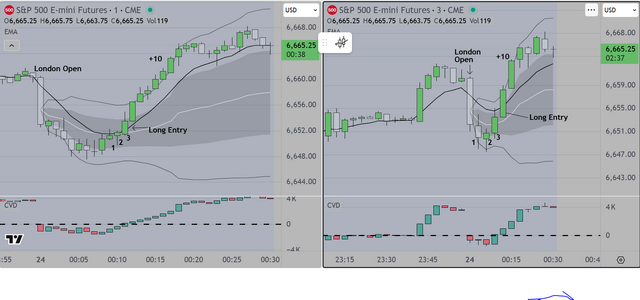
1)The basic premise is that the London Session often exhibits "drift" (there is research on
this subject from the NY Fed), so when it moves directionally, one has ask "what is the
purpose"? In this instance, the London market is "staging" inventory (getting short)
in anticipation of upcoming negative news? We think so. AND that negative news
would be A) the US FED deciding not to lower interest rates, and B) Economic News
that might show that the US economy is having problems (inflation for example).

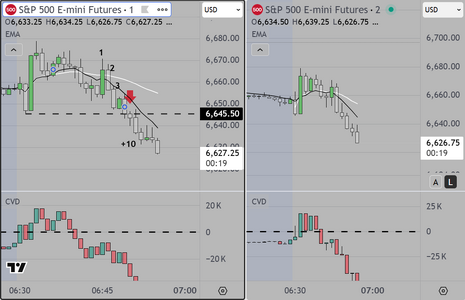
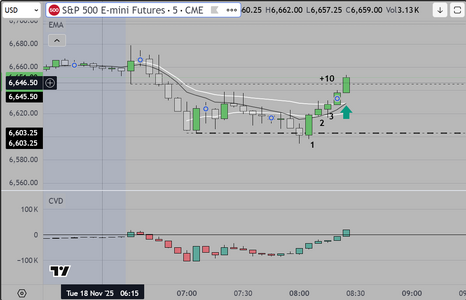
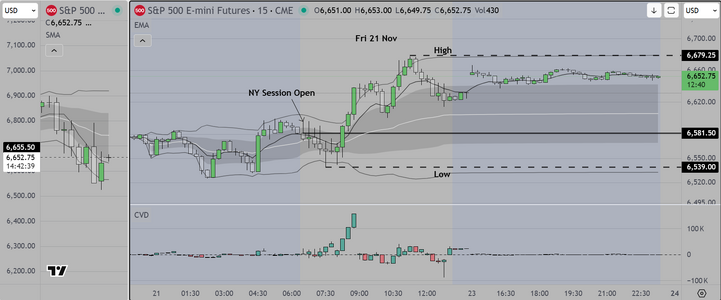
2) When the NY session opens, the Market tries to move higher twice and fails. We
have already described this in previous posts (professionals call this a "H2") and once we
see that second attempt fail, most skilled operators will be ready to sell it down.
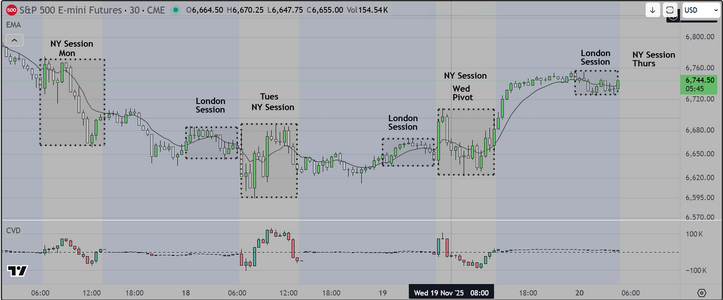
Timing

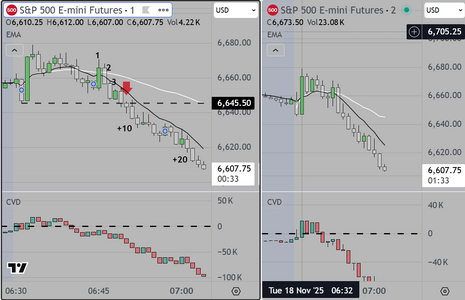
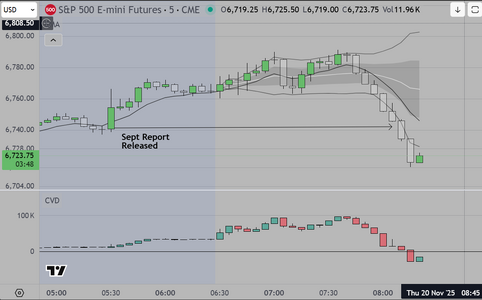
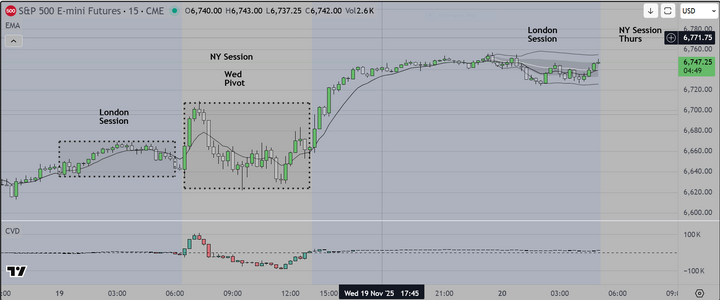
We outlined the open and close of the US/Euro Overlap. Notice how the market moves
lower right at the CLOSE of the overlap. Skilled traders learn to think in terms of "timed
opportunities" and when the timing and price action lines up, they are able to trade
with confidence (they can take a position and hold it long enough to make significant
profit, rather than just scalping for 1 or 2 points and hoping not to get stopped out.

Its all about understanding the logic prior to the open, then confirming the price action
in real time, and finally, taking, and managing the trades. These are the skills a good
professional has to learn.

Good luck
 

Attachments

  • Market Recap.PNG
    Market Recap.PNG
    120.5 KB · Views: 19
Good Afternoon London

Did not have time to go through my usual prep today
(still not feeling up to par)

The attached chart shows the first trade today based on
a 1 min chart and with benefit of a "1-2-3" setup that is
(for me) mandatory. I was willing to accept the risk given
the context of the market (uncertainty) and the US government's
failure to release data, which only fuels that uncertainty.
When that happens, where do you thing the market is going to
go, especially early in the session. Down
Easy +10

And now we wait for the end of the "Overlap"

From this point forward we will switch to a display that shows
3 min and 5 min charts. We go into the reasons for this in our class.

Good luck
 

Attachments

  • Tues 18 Nov First Trade.PNG
    Tues 18 Nov First Trade.PNG
    85 KB · Views: 13
Here is an update on that first trade

As seen in the chart attached below we got out at +10
and the market continued to run to +20 so we left money
on the table.

This is why we suggest traders do not trade when impaired
by illness, grief, family matters, etc. Your (in this case "my")
judgement is not right. Normally I would have chosen an
automated entry that would have taken partial profit at 10
then left a residual to "run". In this case I got flat at +10

An important lesson we all that (apparently) we have to learn
again.
 

Attachments

  • First Trade Update.PNG
    First Trade Update.PNG
    91.7 KB · Views: 11
One of the techniques we teach is the use of an
Anchored VWAP and Standard Deviation Envelope
These tools are in common use among professionals who
use them for both Trend Following and Mean Reversion
trading. On the attached chart we show an example of
a technique call the "Pinch", which uses two (2) Anchored
VWAPs to create an area from which the Market may (or may not)
breakout. If & when it does, we look for a retest or setup
to enter aligned with either the Daily or 4 hour time frame.

Good Luck
 

Attachments

  • Examples of  Pinch.PNG
    Examples of Pinch.PNG
    75.4 KB · Views: 11
Pinch Trade Example
Break to the upside near end of US/Euro Overlap
Partial profit at +10, letting residual run to last hour if possible
 

Attachments

  • Pinch Example.PNG
    Pinch Example.PNG
    62.5 KB · Views: 12
Hello London & Euro Traders
It is 3:36am in the City

Tomorrow we have the following High Impact Reports Scheduled

1) Import/Export Price Index for October (revised) at approximately 1pm London time
2) FOMC Minutes at 6pm London

I have already provided (previous posts) examples of how I prepare to trade these
"Windows of Opportunity" (including how to use multiple Anchored VWAPs to create
a "pinch" trade as price breaks out.

The basic plan(s) will be created at 2pm London Time.
15-30 minutes later, we should be in a trade, managing a position
that is ahead +10 (or stopped out).
At or shortly after 5pm, we will start to monitor price action for another
trade entry after the FOMC minutes are released. Depending on whether
the Minutes negate or confirm a rate cut, we may hold that trade into the last hour.
And the "Power Hour" trade will happen (as always) at 8pm with our target to be
+10 pts.

Final Note

We attach a combination chart (Daily bars on the left/15 min bars on the right)
so interested traders can see another example of how we prepare. Because we
are still feeling under the weather, we will not be livestreaming tomorrow, however
we will post if time permits

Good Luck
 

Attachments

  • Day Week Combo.PNG
    Day Week Combo.PNG
    151 KB · Views: 10
Last edited:
Good Afternoon London & Euro Traders
where it is just after the lunch hour

We attach a chart of the London Session of the S&P500 Futures
We did not take this trade (sleeping & recovering from illness)
however it offers struggling traders a lot of important information
as follows

1) One of our most important tools is the Fixed Range Volume Profile
On the attached chart we show it anchored at the beginning of the Asian
Session and it extends to approximately 7am where (if we were trading)
we would consider it a window of opportunity and start to scan for a trade

2) Our next important tool is the Anchored VWAP (interested readers should
take the opportunity to read comments and view Brian Shannon's YouTube
Videos regarding the use of this important tool). To trade this window of opportunity
we anchor the VWAP one (1) hour prior to the London Open. It provides an objective
view showing whether buyers or sellers are in control.

3) Next we evaluate price action, and in this chart we see price moving above the VWAP
THEN sellers come in to try to move the market lower (unsuccessfully) two times. Professionals
call this an H2 or L2 setup. The principle is simple. If the market tries twice to move in a direction
and fails, it is likely to move in the opposite direction or simply consolidate. That is what happened
in this instance

4) Finally the Cumulative Volume Delta comes into play. We have been testing different setups for this
indicator. The current version we will teach uses an Anchor period of four (4) hours and a custom time
frame of one (1) minute. As readers can see, when all the planets line up, as they did in this session
this volume based indicator provides confirmation as it moves from below the zero line to above

The charts on the left side of the display shows the positive result
While the right side chart shows the CVD settings

Good Luck
 

Attachments

  • Wed 19 Nov.PNG
    Wed 19 Nov.PNG
    99.4 KB · Views: 10
  • CVD Settings for London.PNG
    CVD Settings for London.PNG
    19.3 KB · Views: 9
And this final look at the 15 min chart markup that we use as
reference for the NY session of the S&P Futures which begins
at 2:30pm London Time.

Notice the "Pinch" in place using VWAPs anchored at the beginning of
the week and more recently just prior to the start of the London Session
The setup is simply to wait for a breakout (and then one of our preferred
setups) for a trade entry

We start with our initial scenarios (long & short) based on analysis of the
economic news (covered in a previous post) as well as the day of week
(today is "Pivot Wednesday" which often marks a turning point in market
direction.

If time permits we may post our initial entry at or near the end of the Initial
Balance period

Good Luck
 

Attachments

  • 15 Min Markup 19 Nov.PNG
    15 Min Markup 19 Nov.PNG
    130.5 KB · Views: 11
First Trade completed at approximately 2:45pm
with a profit of 20 S&P points

As seen in the chart, I favor the 1 min time frame for my
initial trade. This is because (for me) it is relatively easy to
determine market direction at the open.

Readers who are skeptical should simply refer to the previous
FOMC day (Which was Oct 8) and look at that price action
These high impact dates often exhibit similar price action
It is something that I have learned to lean on.

Now that I am +$1,000/contract, I will switch to risk management
and simply watch until the next window of opportunity at close of the
US/Euro Overlap.

Good Luck
 

Attachments

  • Wed First Trade.PNG
    Wed First Trade.PNG
    145.3 KB · Views: 11
Good Afternoon London & Euro Traders
It is almost 1pm in the City

We attach a Weekly Chart which shows the cycle we use as
basic reference. The week is split into two (2) parts and Wednesday
is considered the "Pivot" meaning that prices often oscillate between
the highs & lows created during these periods and when they do, professionals
call this a "Round Trip". This Weekly Chart uses 30 minute candles

In addition we attach a chart that shows a more granular view starting on Wednesday
and it uses 15 minute candles.

We won't be going through the entire preparation process (see previous posts for that purpose)
However we continue as before to evaluate market context, including the impact of pending
economic news including the September Jobs Report below.

PENDING ECONOMIC REPORTS

The consensus among economists for the delayed September 2025 jobs report (Nonfarm Payrolls) is an increase of approximately 50,000 to 52,000 jobs. The report is being released this morning, November 20, 2025, by the Bureau of Labor Statistics (BLS).
Key consensus forecasts for the report are:
  • Nonfarm Payrolls (jobs added): Economists expect an increase of around 50,000 jobs. This would be more than double the weak 22,000 jobs added in August but still indicates a cooling, "anemic" labor market.
  • Unemployment Rate: The consensus is that the rate is expected to hold steady at 4.3%.
MARKET LOGIC

If the report comes in below consensus, paradoxically it may cause the markets to move higher, because it may cause the FED to LOWER
INTEREST RATES. If instead it comes in at or near consensus, then again paradoxically it could cause the market to trade lower because
the FED would be less inclined to lower rates.


We continue to recover from illness so no Livestream yet.

As before we may post a trade (or two) if time permits

Good luck
 

Attachments

  • Weekly.PNG
    Weekly.PNG
    118.2 KB · Views: 9
  • Weekly Pivot 2.PNG
    Weekly Pivot 2.PNG
    99.7 KB · Views: 8
Last edited:
Based on the Pre-Market Chart seen below
it seems clear that the consensus is for the market to trade lower

Report to drop in two (2) minutes
 

Attachments

  • Pre-Report Market.PNG
    Pre-Report Market.PNG
    110.1 KB · Views: 7
Based on the initial response to the Sept Jobs report
our analysis was wrong. The market reacted by moving
slightly higher. That's fine, we will continue to monitor
and see if that sentiment holds
 

Attachments

  • Report Release.PNG
    Report Release.PNG
    50.1 KB · Views: 8
As mentioned in the previous post, our initial prediction was wrong
however, as often happens, if one is patient, and the logic is correct
eventually the Market responds in a reasonable way

Without going into all the details, the Sept Jobs Report was a mixed bag
of good and not so good news. The market moved higher giving buyers
the impression that this would motivate the FED to lower interest rates.
Upon closer evaluation and with benefit of comments by several institutional
analysts, it became clear that the odds of lower rates were almost unchanged.

Shortly after the end of the Initial Balance, sell volume came in to move the market
lower. As with most similar events, those who figured out the logic made money
others got trapped, thinking that the market was going to continue higher. That's
usually how it works out (a chess game).

I am still not feeling right and am standing aside for this session

Good luck
 

Attachments

  • NY Session 20 Nov 2025.PNG
    NY Session 20 Nov 2025.PNG
    72.9 KB · Views: 10
Hello London & Euro Traders

We provide a list of two (2) high impact reports scheduled for
release prior to the open of the NY session

1) Flash PMI for November. This report provides a survey of both
manufacturing and services sectors. Because this follows the government
shutdown, it is going to be the focus of attention
2) University of Michigan Consumer Sentiment Index (revised). Consensus is
that this report will disclose a significant decline due to concerns about the shutdown

We assume that the market will respond similarly to what happened yesterday
with an initial move up, followed by a leg lower, at some point after the Initial Balance

Good Luck
 
So the attached chart shows the Weekly Cycle
We point out the following for struggling traders
Please follow along because what we suggest could
be the difference between making a nice living and
struggling (and eventually having to stop because you've
run out of money.

Context

The weekly chart (obviously) begins on Monday, and it is considered
the primary or "Key Reference" for professionals. In this instance the high
of the NY session, remained the weekly high until Thursday. At the end
of the London Session, price traded higher BEFORE AND AFTER release
of the Sept Jobs Report. This test of a previous Monday High and the economic
data, allowed the institutions to move the market higher at the open,
convincing buyers that the market might continue higher and it did
during the first hour (also known as the "Initial Balance").

Institutions "Slam the Door"

This behavior used to be called "Pump & Dump" meaning that the institutions
would buy, and buy more, then at a specific time, the rug would be pulled out
from under the buyers as the market reversed on significant and consistent
sell volume

How to Trade this Scenario

No matter what you call it, the real issue is "how do I trade it?"
and the simple answer is

1) Educate yourself. Learn to anticipate these kinds of behaviors
Learn how to analyze your Higher Time Frame (Weekly) chart
so that you can identify and plan for these kinds of behaviors
2) Learn to create a "valid" trading plan. This means that you can
write out a scenario that calls out the possible price paths, showing
where price will likely move a) at the open, and b) after the initial balance
So that you will know when and where (at what prices) to look for
an entry
3) We attach a second chart showing price action on a chart using 5 min bars
AND we show the volume of each bar. Here you can see how & WHEN the
market "rolls over", and as importantly, you can see increasing volume as
institutions add to positions to keep the momentum going to the downside.
Once you learn how to do this, it changes your world. It certainly changed mine

Good Luck
 

Attachments

  • Weekly Cycle 11-20-2025.PNG
    Weekly Cycle 11-20-2025.PNG
    153.2 KB · Views: 6
  • Bar by Bar Vol Analysis.PNG
    Bar by Bar Vol Analysis.PNG
    94 KB · Views: 6
Hello London & Euro Traders

The attached chart shows the weekly price action using 60 min bars
We analyze the price action using a simple formula. We categorize
by trend (10-20 points minimum) or Trading Range (3-5 pts high to low)
then depending on the frequency of occurrence we say the market for that
time period is either trend, or trading range). There is also a third category
which is labeled "mixed" and that is when the price action creates a
broad channel that trends up or down (professionals also call this "Grinding").

Objective

Our goal is to identify market inefficiencies (period of time when the market can
be exploited by traders with minimum risk, to obtain positive returns). In this case
we see a market that is mostly trending. Those who did their homework the week
before would have discovered this and presumably, they would have concentrated
on momentum strategies, (and would have made money) It is part of an program
we teach on "Adaptive Market Theory".

Good luck
 

Attachments

  • Weekly Trend vs Trading Range Analysis.PNG
    Weekly Trend vs Trading Range Analysis.PNG
    136.2 KB · Views: 0
Back
Top