You are using an out of date browser. It may not display this or other websites correctly.
You should upgrade or use an alternative browser.
You should upgrade or use an alternative browser.
Our final trade for Friday 11-7
We acknowledge that this is not for everyone
as it is evening in London and people have lives to live.
For those who may want to obtain this kind of reward
THIS is the cost in time, and of course there is very real
risk involved as well
This last trade of the evening was profitable at +20 if held
The reason we held (it is 1pm in the afternoon here) is that
We anticipated that institutions would place MOC (Market on Close)
orders that would create an imbalance on the "Buy Side" toward
the close of the session. That is exactly what happened, lifting
the market.
Our mentor offered the following comment regarding the "Power Hour
Trade in general.. We asked him whether this kind of trading was considered
"aggressive", and he replied "yes it certainly is" and "I have lost money on
occasion with this trade." When pressed further, he suggested the following
"Generally speaking, "aggressive trading works well if you are skilled
and accept that sometimes you will lose. It's the world in which we operate
We are paid to accept (and manage) risks like this. The best traders I know tend to
be aggressive and like professional athletes, they learn not to let the inevitable
periodic losses injure them emotionally. Just stay within the parameters of
your account size. Never risk more than 1 or 2% max.
Good Luck
Attachments
Last edited:
Hello London & Euro Traders
It is Saturday and I have completed my "Full Cycle" Markup
for the time period Thursday 6 Nov to Friday 7 Nov 2025
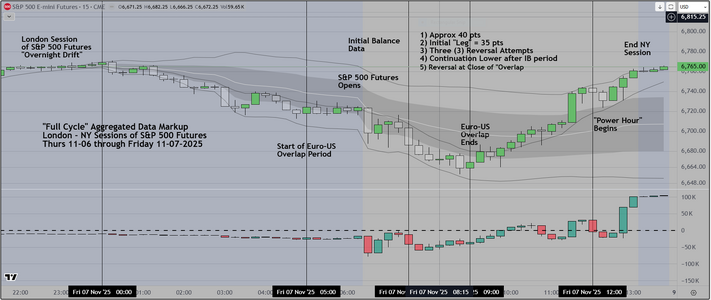
This chart shows the price action and presents (some though not all)
of the "aggregated" data that we obtained during these periods. We
use this to inform our trades in subsequent sessions. Skilled operators
who know how to use this data, have a significant edge over non-skilled
participants. For example, because I do this every weekend, I knew prior to the
NY open, that the "First Leg" would likely provide an opportunity to obtain
(at minimum) +10 and likely +20 pts IF I could find a reasonable setup to trade
in the direction of the previous trend (professionals call this "the drift")
After that, one looks for evidence that the market is responding to current news
which is either economic releases or political and can be anticipated using any
Economic Calendar. The Chart divides the session(s) into Five (5) distinct "windows"
during which a skilled operator can make money, depending on the price action they see.
Using this context, we plan a trading day, by predicting how it might play out, then making
adjustments as necessary
As with most pursuits it takes a short while to learn but after that, success depends on applying
the basics (system edge, execution, risk management, record keeping). No different than any
other business really. People willing to do the work find that money is put into their accounts
while the other side is having money subtracted from theirs. As regards the impact of random
chance, yes, it is a part of this profession. Skilled participants learn to use it to their advantage.
The "White Glove" system we are going to release shortly uses this process to evaluate the trade
Students are advised to watch first, while we trade it with a specific goal to reach +10 within the first "window"
After that we provide the services necessary to go from amateur to professional status. For example
we show the student how to determine whether they are in a limit order or MIT environment and
how to automate their orders in order to avoid slippage.
Good Luck
Postscript...Corrected a "typo"
It is Saturday and I have completed my "Full Cycle" Markup
for the time period Thursday 6 Nov to Friday 7 Nov 2025
This chart shows the price action and presents (some though not all)
of the "aggregated" data that we obtained during these periods. We
use this to inform our trades in subsequent sessions. Skilled operators
who know how to use this data, have a significant edge over non-skilled
participants. For example, because I do this every weekend, I knew prior to the
NY open, that the "First Leg" would likely provide an opportunity to obtain
(at minimum) +10 and likely +20 pts IF I could find a reasonable setup to trade
in the direction of the previous trend (professionals call this "the drift")
After that, one looks for evidence that the market is responding to current news
which is either economic releases or political and can be anticipated using any
Economic Calendar. The Chart divides the session(s) into Five (5) distinct "windows"
during which a skilled operator can make money, depending on the price action they see.
Using this context, we plan a trading day, by predicting how it might play out, then making
adjustments as necessary
As with most pursuits it takes a short while to learn but after that, success depends on applying
the basics (system edge, execution, risk management, record keeping). No different than any
other business really. People willing to do the work find that money is put into their accounts
while the other side is having money subtracted from theirs. As regards the impact of random
chance, yes, it is a part of this profession. Skilled participants learn to use it to their advantage.
The "White Glove" system we are going to release shortly uses this process to evaluate the trade
Students are advised to watch first, while we trade it with a specific goal to reach +10 within the first "window"
After that we provide the services necessary to go from amateur to professional status. For example
we show the student how to determine whether they are in a limit order or MIT environment and
how to automate their orders in order to avoid slippage.
Good Luck
Postscript...Corrected a "typo"
Attachments
Last edited:
Hello London Traders
Currently it is 5pm in the City
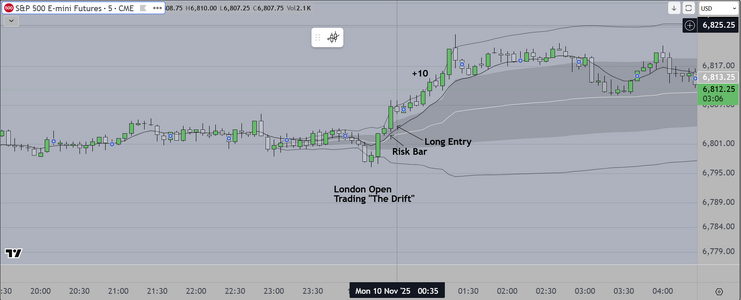
We had a good "Split Session" from this US based trader's
perspective. We traded "The Drift", which is a high odds of success,
timed entry setup that occurs at the Open of the London Session
of the S&P500 Futures, then got some sleep before coming back
to trade the NY open of the same market
We attach charts of both
"The Drift" is a phenomena written about by the NY Fed, and in summary
it states that a significant amount of earnings are made during this time
period (just prior to, during and after the London Open). Professionals call
this a "layup" because when the setup occurs it is low risk, high profit.
and our standard markup for the NY session. Here we rely on our pre-market
research and notes. News relating to the ongoing train wreck of the US economy
caused by our President, continues to wreak damage. Institutions have little to rely
on because economic news is delayed. They are going to private sources for info
and acting very cautiously, and yet they still have to put money to work. What you are
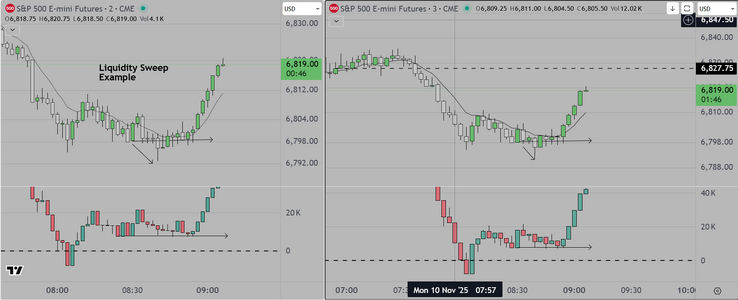
seeing is the predictable opening and trading range behavior followed by a trend move
and then nothing until the end of the US-Euro Overlap
In this 2nd attached chart we show a "liquidity sweep"
Good Luck
Currently it is 5pm in the City
We had a good "Split Session" from this US based trader's
perspective. We traded "The Drift", which is a high odds of success,
timed entry setup that occurs at the Open of the London Session
of the S&P500 Futures, then got some sleep before coming back
to trade the NY open of the same market
We attach charts of both
"The Drift" is a phenomena written about by the NY Fed, and in summary
it states that a significant amount of earnings are made during this time
period (just prior to, during and after the London Open). Professionals call
this a "layup" because when the setup occurs it is low risk, high profit.
and our standard markup for the NY session. Here we rely on our pre-market
research and notes. News relating to the ongoing train wreck of the US economy
caused by our President, continues to wreak damage. Institutions have little to rely
on because economic news is delayed. They are going to private sources for info
and acting very cautiously, and yet they still have to put money to work. What you are
seeing is the predictable opening and trading range behavior followed by a trend move
and then nothing until the end of the US-Euro Overlap
In this 2nd attached chart we show a "liquidity sweep"
Good Luck
Attachments
Hello London & Euro Based Traders
It is 9:35 in the City
As we draw closer to the start of my trading Livestream
I thought it appropriate to post this chart, which is a part of the
Weekly Preparation Process. It is called the "Weekly Cycle Pivot"
Most professionals divide the week into a front and back half. The
Front half obviously starts on Monday, and the H/L range is the "IB"
or Initial Balance. Institutional participants look at this framework
to provide guidance as regards market bias, and opportunities to
add or subtract from existing positions. On shorter time frames
speculators and other commercials look to trade for short term
profit based on a "Test/Fail" protocol. Each day or evening we
assess the previous price development and create an initial prediction
and from that a trading plan (If A, then B format). When we train
other professionals, we provide both aggressive and conservative
risk models. Now that we are considering training Retail we will
provide less aggressive risk models, with more emphasis on risk
management. This is why on the charts we post, we identify a "risk bar"
whose purpose is to show where to place a stop loss, AND we also
show the minimal profit target (about +10). In truth we always suggest
that traders trade at least 2 contracts, taking partial profit at at a
low risk point that is known as "buying a stop". Once a trader books
that initial profit, we suggest they use an automated system
to let the residual run as long as possible. One possible automated
order example is Chuck LeBeau's "Chandelier Stop".
Good Luck
Attachments
Copying this post from another thread for the benefit of interested readers
------------------
I have pointed this out a couple of times previously
Reading order flow is fine IF you have the skills and can keep up
with fast market conditions. Few (if any) retail traders have the skills
or the talent. I have been doing this for many years and still find it
challenging to keep up and make good decisions. What makes it
easier to is to consolidate the data using CVD (once you learn how
to set it up to achieve the proper granularity for your target market)
Then it is a matter of watching the price action at specific points in time
and matching what you see to the volume coming onto your screen.
Nothing works perfectly of course. But in my opinion it is a easier and
more accessible way to trade (for amateurs).
I will attach a chart, but without the proper background it will probably not
make much sense at first. Reading up on the subject of Cumulative Volume
Delta might be a good idea. As I have mentioned I will be LiveStreaming my
own trading in the coming days on Twitch and YouTube. I don't plan to do
that for very long, so it might be a good idea to visit and take a look. It might
help you
Postscript
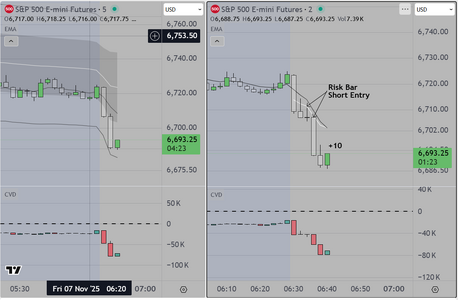
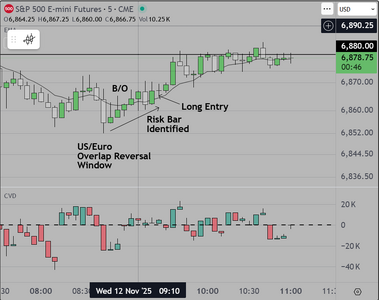
The chart shows the S&P 500 Futures Market (NY session). CVD at the bottom
setup to provide max granularity. Price action shows a breakout (B/O above a key
reference) The CVD updates at intervals that align with the B/O so (eventually) the
trader learns to see whether the breakout has legs or is stalling on low volume.
Learning to identify the components (price action & volume) accurately is what
is required for success.
Good luck
------------------
I have pointed this out a couple of times previously
Reading order flow is fine IF you have the skills and can keep up
with fast market conditions. Few (if any) retail traders have the skills
or the talent. I have been doing this for many years and still find it
challenging to keep up and make good decisions. What makes it
easier to is to consolidate the data using CVD (once you learn how
to set it up to achieve the proper granularity for your target market)
Then it is a matter of watching the price action at specific points in time
and matching what you see to the volume coming onto your screen.
Nothing works perfectly of course. But in my opinion it is a easier and
more accessible way to trade (for amateurs).
I will attach a chart, but without the proper background it will probably not
make much sense at first. Reading up on the subject of Cumulative Volume
Delta might be a good idea. As I have mentioned I will be LiveStreaming my
own trading in the coming days on Twitch and YouTube. I don't plan to do
that for very long, so it might be a good idea to visit and take a look. It might
help you
Postscript
The chart shows the S&P 500 Futures Market (NY session). CVD at the bottom
setup to provide max granularity. Price action shows a breakout (B/O above a key
reference) The CVD updates at intervals that align with the B/O so (eventually) the
trader learns to see whether the breakout has legs or is stalling on low volume.
Learning to identify the components (price action & volume) accurately is what
is required for success.
Good luck
Attachments
Good Evening London & Euro Traders
Most of whom have long ago headed home or to the pub
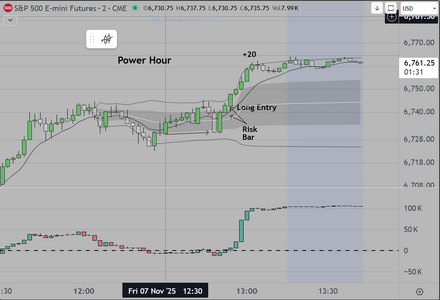
It is about 8:30pm and the Power Hour trade happened
as it often does, with algos executing MOC orders (for a variety
of reasons), none of which are important at this moment
The bottom line is that this trade (for skilled operators) is very
lucrative because it is low (again depending on skill level)
risk/high return. Another +10. Here in the US, it is a little after
the Noon hour and I am done for the day.
Postscript
At the closeout of my day, I had a guest watching (in my home). They
trade as amateurs do, just as a hobby. They watched and observed
that (for them) it was fearful to enter because they worried about the possibility
of a quick reversal so close to the end of session. I remarked that while that
could happen, as could a natural disaster, or shut off of power, or any number
of things, one had to assume those risks, protect themselves as best they could
and take the trades. Here is a quote from a famous movie
"I must not fear.
Fear is the mind-killer.
Fear is the little-death that brings total obliteration.
I will face my fear.
I will permit it to pass over me and through me.
And when it has gone past, I will turn the inner eye to see its path.
Where the fear has gone there will be nothing.
Only I will remain."
Good luck
Most of whom have long ago headed home or to the pub
It is about 8:30pm and the Power Hour trade happened
as it often does, with algos executing MOC orders (for a variety
of reasons), none of which are important at this moment
The bottom line is that this trade (for skilled operators) is very
lucrative because it is low (again depending on skill level)
risk/high return. Another +10. Here in the US, it is a little after
the Noon hour and I am done for the day.
Postscript
At the closeout of my day, I had a guest watching (in my home). They
trade as amateurs do, just as a hobby. They watched and observed
that (for them) it was fearful to enter because they worried about the possibility
of a quick reversal so close to the end of session. I remarked that while that
could happen, as could a natural disaster, or shut off of power, or any number
of things, one had to assume those risks, protect themselves as best they could
and take the trades. Here is a quote from a famous movie
"I must not fear.
Fear is the mind-killer.
Fear is the little-death that brings total obliteration.
I will face my fear.
I will permit it to pass over me and through me.
And when it has gone past, I will turn the inner eye to see its path.
Where the fear has gone there will be nothing.
Only I will remain."
Good luck
Attachments
Last edited:
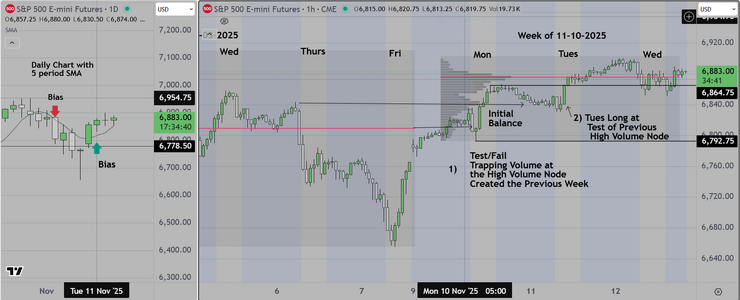
Hello London & Euro Traders
For those who may be interested in attending my "LiveStream" please come on time
and be ready to watch the preparation. We start by (briefly) reviewing the longer time frame
price action, proceeding to a specialty chart that uses (primarily) Volume Profile to determine
the location of High & Low Volume Nodes. On the chart attached below, we show the IB for
the previous week and project onto the next week.
Our objectives are to
1) Identify "trapped volume" and from that,
2) Predict, where the institutions will move the market in order to
3) Maximize the value of the pre-existing staged positions or
4) Add to or reduce risk ("Value at Risk Adjustment") or when absolutely necessary/as a last resort)
5) "Take Profits". Here I conclude by suggesting that as long as they (institutions) maintain a presence
they can increase profits for themselves and shareholders. If however circumstances force them to
"Take Profit" then they are back to square one, and they have to start the process all over again.
As a close examination of the chart will disclose, we try to outline the broad strokes so that a trader can
learn how to align themselves with the institutions intent.
So this is it in a nutshell, I evaluate the data and create a plan. For a limited time, observers can watch
as I do this, and execute. At some point I will close that down and folks will have to decide whether to
apply for a place in my class or move on to something else that makes more sense (to them).
While this is going on I would like to create a little buzz and drive more interested people towards "Trade2Win"
so that they can also benefit from the increase in traffic. I can only hope that is thought of as honorable.
Good Luck
Attachments
Last edited:
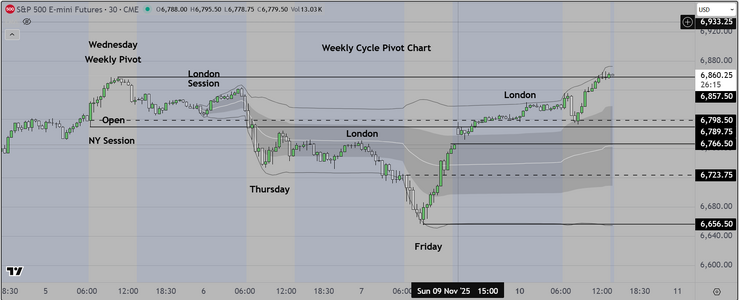
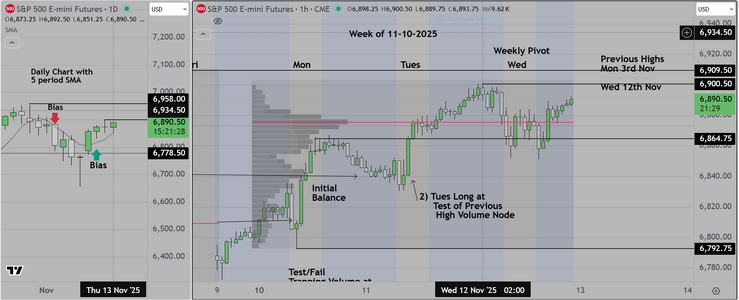
Posting this Weekly Pivot Chart
Wednesday is considered the Weekly Pivot by Trading Professionals
Price action from that point of reference is significant
We analyze price action based on that session high & low and in
comparison to the POC (point of control) created from the beginning
of the week. These are the key references that institutions use in order
to decide where to move markets
Based on what we see the markets are continuing higher however the lack
of data is causing institutions to hesitate here (at previous highs). Our initial
prediction for the NY session of the S&P500 is as follows
We expect a move higher early in the session followed by a reversal as institutions
look to protect (take) profit. This based on the additional data that will be provided
on a staggered basis by US government agencies that have previously been closed
Some of the data will be unavailable because those agencies (being shut down) have
not been able to collect it. That lack of data related to employment may cause
concern leading to a move lower.
The reaction to the US opening government agencies again will be seen in the London
Open first.
Attachments
Hello London
We have posted about this "Window of Opportunity" (one of several)
and it is interesting to us, because it provides skilled operators with a
a trade that is often very profitable. It does require experience and
the ability to manage the trade.
In the attached chart, we show one of our setups, an algo that we developed
We aren't going to detail it here. It requires dialogue between teacher and student
and the ability to show how it develops in real time. As mentioned that will
be happening soon.
Attachments
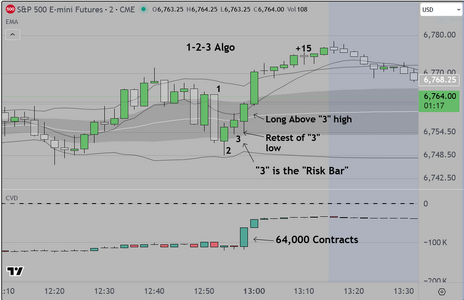
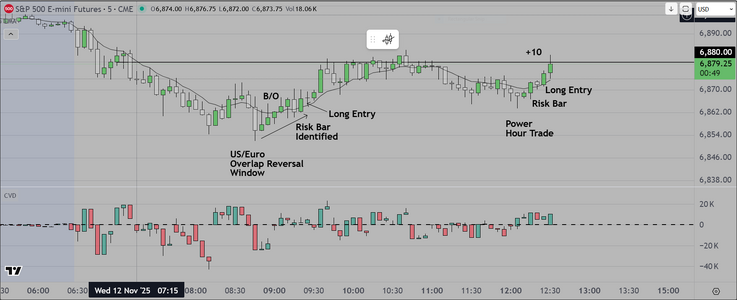
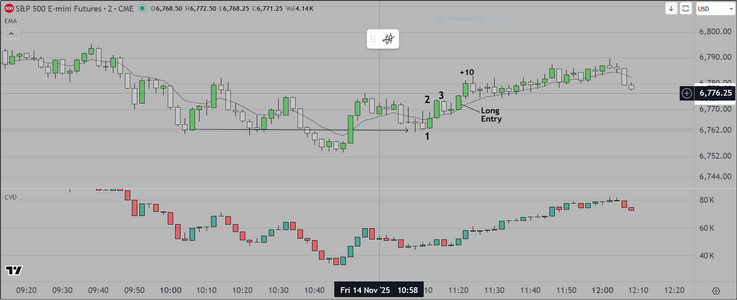
Good Afternoon/Early Evening, London and Euro Based Traders
We want to provide an example of the Algo based entry setup we
employ. The Algo itself is simple (1-2-3). We look for specific behavior
to identify that initial setup. Our next requirement is to identify the "Risk
Bar". This bar is used by professionals to create a quick estimate of what
the initial risk is for the trade. With this information in hand, they can
look for a probable profit target and decide "is this trade worth that risk?"
(or "how likely is it that my profit target will be hit?") After that it is all about
entering using the correct order type to enter & exit, and managing the position
to its logical conclusion.
Interestingly, those who make this into a sustainable business, do so by
learning first how to manage risk, "thus the importance of the Risk Bar, THEN
they concentrate on maximizing profit (which is relatively easy to do).
Postscript
The attached chart shows one (1) trade. Actually there are two (2) on this chart
and the second is easy to see (in our opinion). We will be interested to see
if anyone takes the time to find it (it is in "plain sight").
Good Luck
Attachments
Last edited:
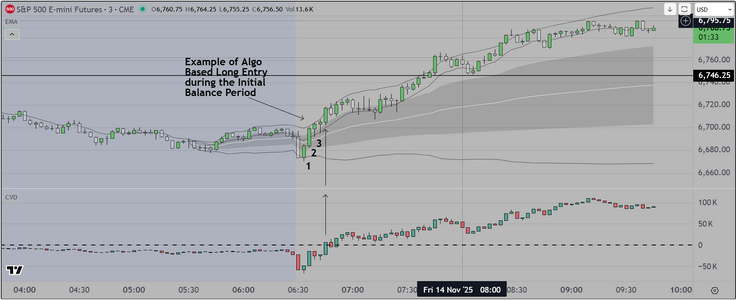
Here is an example of the way that a "1-2-3" Algo can be adapted to fit
many situations. An observant person will notice that price creates a ledge
which is a price at which other algos are programmed to enter a value based
trade late in the (NY) session. Professionals know that most NY based traders
have already quit for the day (it is the weekend after all). So all of this is automated
and easy to monetize. You watch the price action, and you wait for the 1-2-3 to
occur relative to a key reference. When it happens, you take the trade, and you don't
have to hold for long WHY? Because 90% of the price action is automated. You get in
you take 10 pts and you get out.
What I am starting to enjoy about this is that there is a natural screening process at work.
Apparently only a few people see the possibilities, while the rest of you are content to continue to make
widgets, sell insurance or office supplies (honest work to be sure but is that what you want for a
career?)
Good luck
Attachments
Still not feeling well enough to invite visitors to the
Weekend Prep
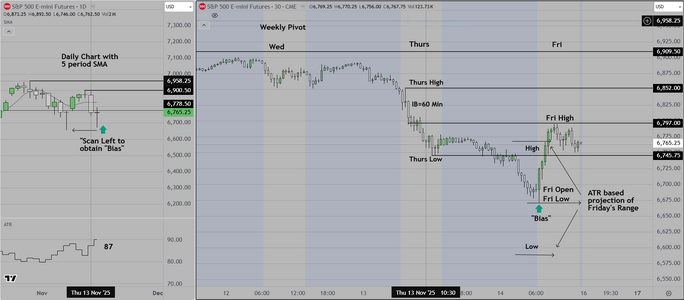
This Weekly Markup chart will provide a way to obtain a
short summary of what I do
1) The small chart on the left uses Daily Bars. We look for the obvious
price action clues. The annotation "Scan Left" reminds us that when price
Tests a level and reacts strongly, it suggests that the same thing is likely
upon retest. In this case the prior move is a pin bar (or "Buyer's Tail") and
the subsequent move up was significant. Naturally, we would expect the same
when price returns to retest that level. AND that is what happened.
2) on the right side, the Weekly Pivot Chart starts with either Monday or Wednesday (Weekly
Pivot), and again we start by looking for the obvious price action clues (range, highs & lows
tests and areas where buy or sell volume might be trapped). In this instance we have a ranging
market, waiting for news and on Thursday (London) reacted by trading lower, and so did the
NY session of the S&P 500 Futures.
3) Prior to the open on Friday, we use the 14 period ATR to forecast the probable range
at the NY open. Based on that reading of 87 pts, we can approximate the range. AND
what we know from "scanning left" on the smaller chart, is that a) if price trades down to
retest the previous low, institutions will probably come in to buy (see our next chart
And that is what happened.
That is why we monitor the weekly chart (each night after the close) watching price action
UNTIL we see a price behavior that creates an edge for us.
Look at the chart and ask yourself if you would be able to figure it out
Good Luck
Weekend Prep
This Weekly Markup chart will provide a way to obtain a
short summary of what I do
1) The small chart on the left uses Daily Bars. We look for the obvious
price action clues. The annotation "Scan Left" reminds us that when price
Tests a level and reacts strongly, it suggests that the same thing is likely
upon retest. In this case the prior move is a pin bar (or "Buyer's Tail") and
the subsequent move up was significant. Naturally, we would expect the same
when price returns to retest that level. AND that is what happened.
2) on the right side, the Weekly Pivot Chart starts with either Monday or Wednesday (Weekly
Pivot), and again we start by looking for the obvious price action clues (range, highs & lows
tests and areas where buy or sell volume might be trapped). In this instance we have a ranging
market, waiting for news and on Thursday (London) reacted by trading lower, and so did the
NY session of the S&P 500 Futures.
3) Prior to the open on Friday, we use the 14 period ATR to forecast the probable range
at the NY open. Based on that reading of 87 pts, we can approximate the range. AND
what we know from "scanning left" on the smaller chart, is that a) if price trades down to
retest the previous low, institutions will probably come in to buy (see our next chart
And that is what happened.
That is why we monitor the weekly chart (each night after the close) watching price action
UNTIL we see a price behavior that creates an edge for us.
Look at the chart and ask yourself if you would be able to figure it out
Good Luck
Attachments
Last edited:
Hello London & Euro Traders
We will not be LiveStreaming our Weekend Preparation so it only seems appropriate
that we provide a sample for those who may want to subscribe in future. Interested
readers can start with the previous post, where we review what happened during
the previous week. In that post we use a Weekly Pivot Chart (which uses Wednesday
as it's most recent "point of reference"). Here is our Higher Time Frame Narrative.
1) Primary Market Mover (Interest Rates)
For the sake of brevity, the bottom line is that the markets moved
lower based on several factors, the most important of which is the anticipation that
the US Fed may decide not to lower interest rates.
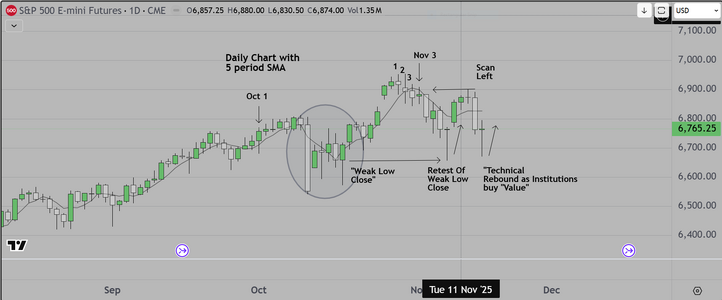
2) Daily/Weekly Time Frame/Opportunities for Swing Traders
Readers who follow along will see that we continue to monitor both the Daily and Weekly
time frames. On the Daily (posted below) we see an S&P 500 Futures Market that has created
what professionals call a potential "Major Trend Reversal" on the Daily Time Frame
That chart shows several trading opportunities for Swing Traders whose horizon is multiple days
to weeks. Readers can start on the right side at Oct 1st and continue to follow along to Nov 3rd
3) Market Structure & Analysis of Previous Trade
Along that path we see a 1) "Weak Low, followed by a higher high, and a "1-2-3" short setup
which is the first reasonable reversal entry that Swing Traders could take. That short entry would
have been filled at or near 6,866 and if held to its logical conclusion, would have exited at 6,665
approximately for a profit of 200 S&P pts (about $10,000 per contract before commissions).
4) Pattern Behavior (How Approach a Trading Range)
The "Retest of the Weak Low" was an area where Institutions are likely to come in to buy what they
see as discounted value. They wait for price to revisit that range of prices and then drive the market back
up, thus creating a "Trading Range". Its the same as the previous trade only in reverse
The next opportunity occurs when price (once again) revisits the upper part of the trading range
so its a "back & forth" kind of trading action that professionals call a "Round Trip" with price moving between
extremes.
5) Next Week (Our Prediction for either "Technical Rebound" or Continuation Lower
Will price rebound? (its called a "Technical Rebound" and move higher, or will the market continue the "Major
Trend Reversal" outlined previously, as institutions become concerned about the US Fed decision, and as
previous economic data is released to the public. Consensus is that the previous data, as well as the new
data will point to a steadily weakening US economy, which of course would lead to a move down as institutions
take profits. This is our prediction.
Postscript ("Using Scan Left to find Direction & Entry)
On our chart you may notice the text "Scan Left". This technique is useful because it provides advance warning
as to what is likely in terms of market direction. Simply put, when price tests an area where previously the market
reacted strongly (higher or lower), it will often do the same thing again.
We will not be LiveStreaming our Weekend Preparation so it only seems appropriate
that we provide a sample for those who may want to subscribe in future. Interested
readers can start with the previous post, where we review what happened during
the previous week. In that post we use a Weekly Pivot Chart (which uses Wednesday
as it's most recent "point of reference"). Here is our Higher Time Frame Narrative.
1) Primary Market Mover (Interest Rates)
For the sake of brevity, the bottom line is that the markets moved
lower based on several factors, the most important of which is the anticipation that
the US Fed may decide not to lower interest rates.
2) Daily/Weekly Time Frame/Opportunities for Swing Traders
Readers who follow along will see that we continue to monitor both the Daily and Weekly
time frames. On the Daily (posted below) we see an S&P 500 Futures Market that has created
what professionals call a potential "Major Trend Reversal" on the Daily Time Frame
That chart shows several trading opportunities for Swing Traders whose horizon is multiple days
to weeks. Readers can start on the right side at Oct 1st and continue to follow along to Nov 3rd
3) Market Structure & Analysis of Previous Trade
Along that path we see a 1) "Weak Low, followed by a higher high, and a "1-2-3" short setup
which is the first reasonable reversal entry that Swing Traders could take. That short entry would
have been filled at or near 6,866 and if held to its logical conclusion, would have exited at 6,665
approximately for a profit of 200 S&P pts (about $10,000 per contract before commissions).
4) Pattern Behavior (How Approach a Trading Range)
The "Retest of the Weak Low" was an area where Institutions are likely to come in to buy what they
see as discounted value. They wait for price to revisit that range of prices and then drive the market back
up, thus creating a "Trading Range". Its the same as the previous trade only in reverse
The next opportunity occurs when price (once again) revisits the upper part of the trading range
so its a "back & forth" kind of trading action that professionals call a "Round Trip" with price moving between
extremes.
5) Next Week (Our Prediction for either "Technical Rebound" or Continuation Lower
Will price rebound? (its called a "Technical Rebound" and move higher, or will the market continue the "Major
Trend Reversal" outlined previously, as institutions become concerned about the US Fed decision, and as
previous economic data is released to the public. Consensus is that the previous data, as well as the new
data will point to a steadily weakening US economy, which of course would lead to a move down as institutions
take profits. This is our prediction.
Postscript ("Using Scan Left to find Direction & Entry)
On our chart you may notice the text "Scan Left". This technique is useful because it provides advance warning
as to what is likely in terms of market direction. Simply put, when price tests an area where previously the market
reacted strongly (higher or lower), it will often do the same thing again.
Attachments
Last edited:
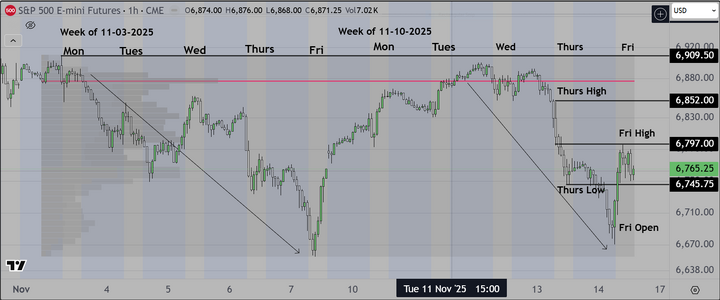
Same principles on a chart with 60 minute bars, over a period of two (2) weeks
As can be seen, price dropped significantly (far left) and we started our Volume Profile
at that point in time. The Red Line is the "Point of Control" and it shows the prices where
most of the trading occurred. As can be seen, it takes a while, but eventually price retests
and then moves lower (again). This repetitive behavior is common. It allows institutions to make
money in both directions. We simply follow along, entering and exiting at the extremes
Good luck
Attachments
Hello Traders
As seen in the previous post, we begin with an analysis of Market Behavior on
a Higher Time Frame. We then transfer that knowledge to the shorter time frame.
Our business model allows us to create at least one (1) Swing Trade AND also
2) operate in the shorter intraday time frame, where (typically) we trade the NY Session
of the S&P 500 Futures.
Pre-Market Narrative
The information we obtained from our Higher Time Frame Analysis allows us to create
Intraday Trading plans as follows
Bullish Plan
As mentioned previously, a technical rebound may occur if institutions decide to buy at specific prices
that they see as representing "value". The short version is that they want to buy at "Wholesale" prices
then mark that inventory up and sell to the rest of us at "Retail" prices. There are two (2) ways to do this
the first is to buy if price tests a support zone (which would be around 5.950 down to 5,900). They would
also be willing to scale in, buying more as low as 5,800 (approximately). We outline a second way to "value"
trade" in our class, and it involves trapping "Sell Volume" at places where participants assume that the market
is moving lower, then "slamming the door", leaving them to decide whether or not to chase (which is why those
moves higher generally continue).
Bearish Plan
The Bearish plan involves, driving the market higher initially, above the highs shown on our Weekly Pivot Chart
then trapping buy volume by reversing abruptly. Skilled traders plan for this eventual occurrence by reviewing
a schedule of pending High Impact Economic reports. Any reputable economic calendar service should do the
trick. For the coming week, the high impact reports are as follows
1) Empire State Manufacturing on Monday
2) ADP Employment on Tues
3) FOMC, Housing Starts, Building Permits on Wednesday
4) Initial Jobless Claims, Philly Fed, Existing Home Sales on Thurs
5) S&P Global Flash PMI, University Of Michigan Final Survey on Friday
Monday & Tuesday are traditionally the most turbulent days, and one would want to capture those bigger
price moves by coordinating trades (aligning trade entry with specific time periods). Subscribers are able
to see how we do this from planning to execution on a daily basis.
Those who follow the logic can see, that this (or something similar) is what professionals do to prepare
and to obtain an edge over the "uninformed". Professionals go into the trading day with more (and better) information
than others. After a period of time, (if they can see a skilled person execute in front of them), they usually "Get It"
Then it is a matter of whether or not they can develop the skill & discipline required to do it themselves. In our opinion
it is similar to the preparation required to be a professional athlete.
Please understand that we will only be doing this once to give prospective students a look at what we provide.
At the end of each session we will provide a summary review here on this site. Basically that summary will outline
our results (successes and failures).
Good luck
Last edited:
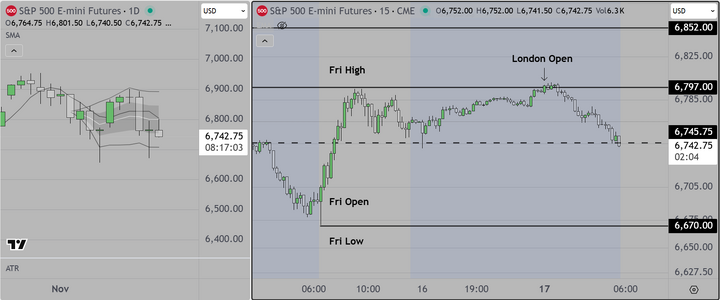
Good Afternoon London
where the time is 1:45pm and we are at the tail end of the London Session of
the S&P 500 Futures. We begin our preparation using the attached chart, which
shows the previous NY session Markup (high/low) using 15 min bars on the right side
and daily bars on the left.
On the Daily Chart we see a trading range, framed by a VWAP envelope, and as mentioned in
previous posts, institutions created this because of the uncertainty as regards reporting of
economic news and concerns regarding the US Fed's willingness to cut interest rates. So basically
long/short trades as price tested the extremes
Shifting to the right side, we see the "London Session" which tested the previous high and then
swept lower, trapping buy volume at 6,800. It was a strong move.
For the coming NY Session open, we envision one of the following scenarios
1) After this strong move, a pullback, followed by continuation lower
2) Reversal after a test of Friday's Initial Balance Bar (3:30 London time on Friday) approximately 6,730
3) Impulse move to either the up or downside during the Initial balance (first 15 to 30 minutes) followed
by a range bound market, moving sideways, as participants wait for economic news (see previous posts above).
The Current 14 day ATR is 88 (approximately) so we know what the potential is for a strong move in
either direction.
Monday is an easy day to trade. If it goes as planned, we will monitor the first 15 minutes and get on board for 10 pts
then adjust our plan as necessary, waiting for possible trades at the end of the US/Euro Overlap at 4pm London
and again during the "Power Hour" at the close. Our plan consists of 1-3 possible trades.
Good luck
Attachments
Last edited:
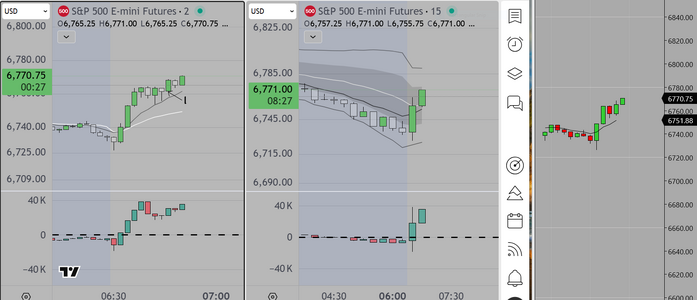
and exit with +10 at 2:56pm
Entry based on a setup known as H2. Simply put the market tries twice
to reverse and is unsuccessful. We enter on the next bar at its open and hold to +10
or stoploss. In this case, we took +10
Now we wait for the US/Euro Overlap window to close
Entry based on a setup known as H2. Simply put the market tries twice
to reverse and is unsuccessful. We enter on the next bar at its open and hold to +10
or stoploss. In this case, we took +10
Now we wait for the US/Euro Overlap window to close
Attachments
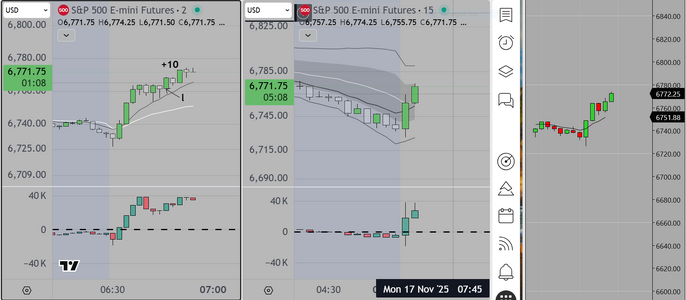
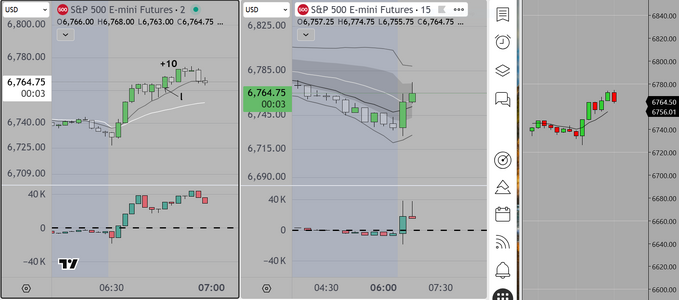
Normally we would not bother with this, but for the retail crowd
we want to show, that this opportunity is known to many other professionals
who take the trade, then get out at approximately the same time (at +10)
Similar to the old saying "use it or lose it". This is "take it or lose it"
The chart shows other traders exiting at this profit point (approximately)
Postscript
If readers will review the previous posts, you will see that the scenario that played out
today (so far) is number three (Impulse move to the upside, then the market trades in a range)
Attachments
Last edited:
Similar threads
- Replies
- 5
- Views
- 4K
- Replies
- 3
- Views
- 4K