A Professional Approach to Trading Futures

Hi Steven46,
While I was studying your analysis and reading chart. I saw that mostly in Asia and London Session price respect the vpoc and vwap level with your 123 reversal very nicely. Is this because of automated algo? Do you prefers these sessions for good trade with nice profit or NYC session?

Thank you
Adnan
 
Hello Adnan

I would like to provide a better answer to your very important question. Although the Asian
and London sessions have less volume, the frequency of setups is about the same, and my
weekend analysis suggests that they percentage that work well are also similar. I do not trade
Asia, however I do sometimes trade London. Most of my trading is the NYC session, which opens
at 6:30am local time. About 70% of the volume traded is automated and that seems to be why
the setups work well (because the computers continue to repeat the same behavior). I continue
to review and monitor the setups that work to make sure that if things change, I am able to
adapt to the changes and continue to make money. So far, all the setups seem to work nicely.

Good Luck Adnan
 
Last edited:
Good Morning from West Coast USA where it is 6:05am and the NY
Session of S&P500 Futures is about to begin

As some readers may remember, I use a weekly template to obtain entries
and exits, for both scalps and longer time frame swing trades. Because I have
not shown the swing trade system outline to readers, I will do that here (Once)
as follows on the attached

As can be seen, the weekly cycle is divided into two (2) parts. Part 1 starts on Monday
and extends to Wednesday. Part 2 starts on Wednesday at the close, extending to Friday
We take trades that form a sequence that professionals call a "peek-a-boo" above and
below the highs and lows. In other words we take the reversals and hold for the long
move back to the other side. For years, this has been a profitable strategy when executed
with discipline.

Typically I take these trades, and then I trade around those positions


Good luck
 

Attachments

  • Weekly Cycle Swing Trades.PNG
    Weekly Cycle Swing Trades.PNG
    134.3 KB · Views: 33
Another Day, another dollar

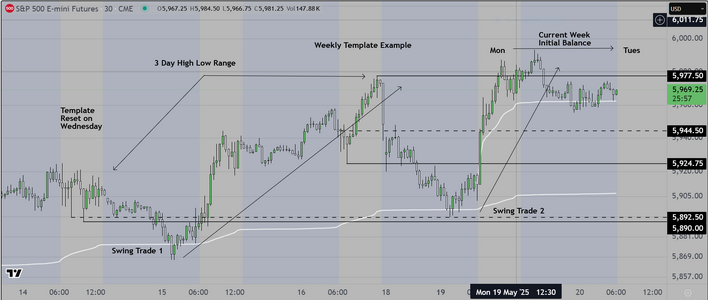
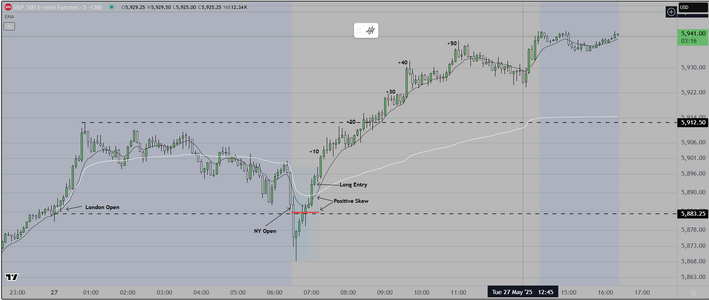
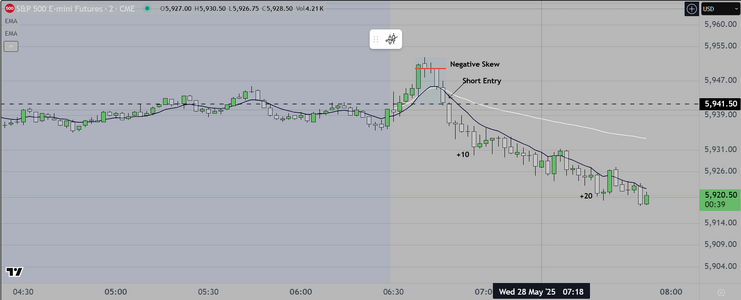
The attached chart shows the simplified version that I teach
The focus is on teaching struggling traders to identify where
they are going wrong and correct that.

What I found in my previous classes, was as follows

1) Lack of preparation
2) Inability to "align their thinking with institutional intent"
3) No system edge
4) Poor choice of, and undisciplined use of the tools of the trade
5) Unskilled decision making on both ends (Entry & Exit)

The result is inevitable

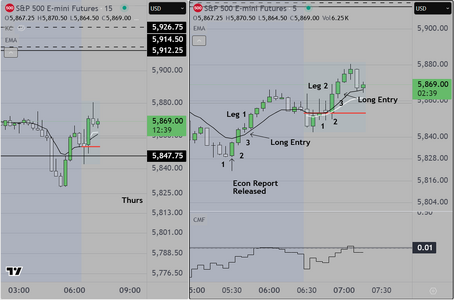
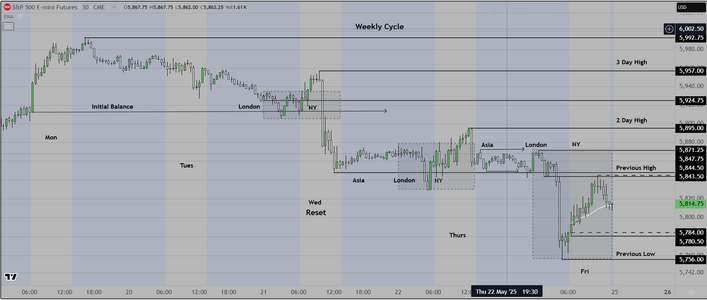
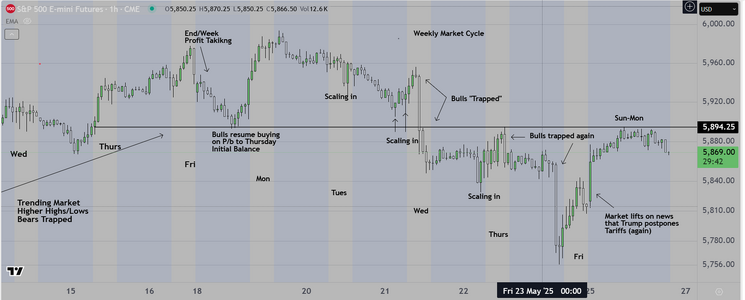
The Chart cannot show the pre-planning that goes into this process
We assume readers know of our preparation over a weekend to analyze
previous price action and economic news. The chart below shows what
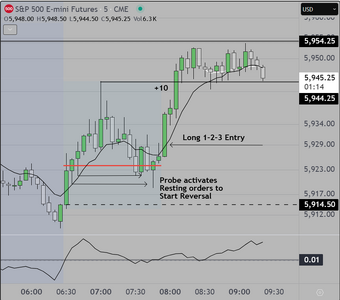
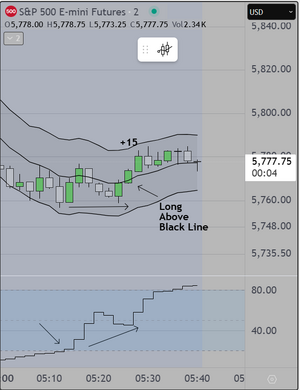
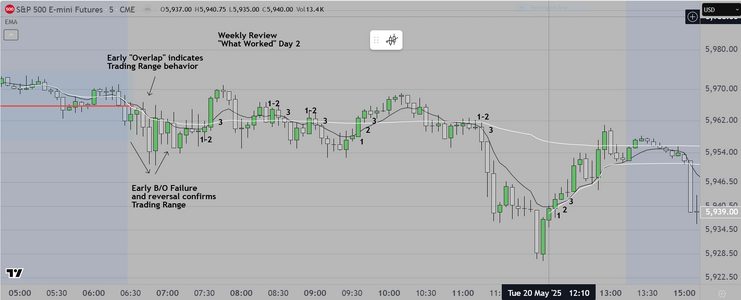
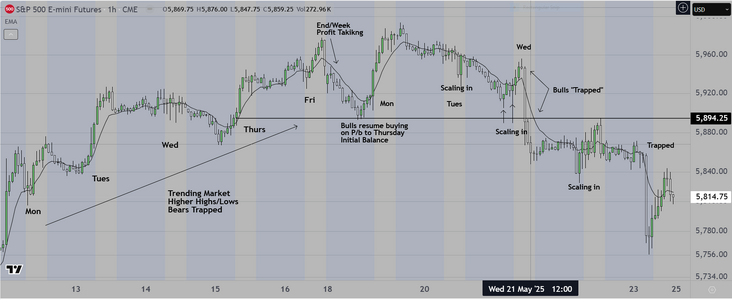
comes next. The skill is to identify the price action on the open, and react
appropriately. We monitor for a specific period of time in order to determine
whether the market is trending or in a trading range. Once we make THAT
decision we enter, at the appropriate time, and designate a profit target and
stop loss. The tools have already been specified. How to use them is part of
the class. Once a student has a feel for this, we look at the decision making
process in detail, especially how to reduce stress, by relying on the system
rules. As with professional sports, success depends on 1) talent first, then on
2) preparation, and finally on 3) "reps" (practice) and by that we mean good
practice, that insures that the student trader is learning the right skills, rather
than developing bad habits.

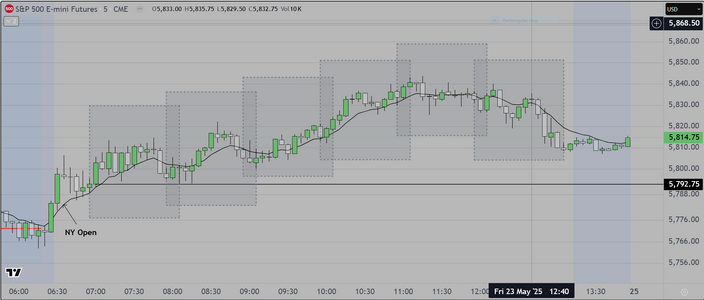
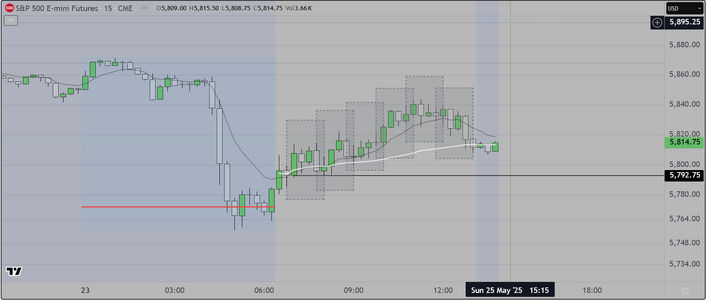
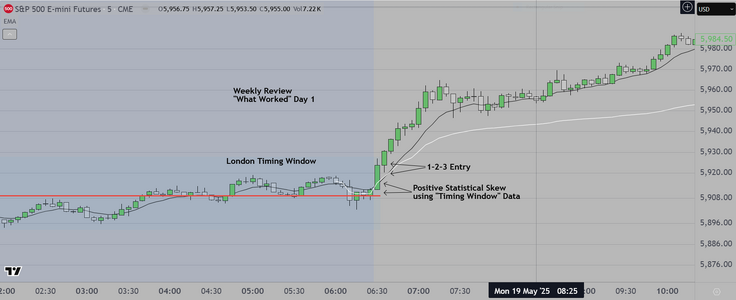
Readers may remember that we suggest trading within a specific timing window
then getting out with a profit. As with any similar situation (casino gambling comes
to mind) the longer you stay, the more the odds favor that you "give back" what
you have won. Once you've earned it, take your money and go live your life.

Good luck
 

Attachments

  • NY Session Results.PNG
    NY Session Results.PNG
    67.1 KB · Views: 10
Last edited:
Today's NY session on a 15 min Chart basis

Some may find this easier to trade, as it produces
fewer false signals
 

Attachments

  • 15 min Chart Example.PNG
    15 min Chart Example.PNG
    90.9 KB · Views: 9
Good Morning Traders

It is 6am on the West Coast USA
We completed our pre-market preparation and
found a nice setup to trade prior to the formal open
of the Session. Readers should take note, that this is
often the case when the Economic News comes in
better then consensus. We have two more high impact
reports scheduled for later this session. We have already
integrated these into our trading plan

Looking at the chart, notice that we display both 15 min and 5 min
candles. Also note that as usual, Institutional traders are "informed"
ahead of time. How do we know this? Look at the skew (Red Line
It is strongly positive prior to the announcement. Algos were activated
both prior to and at the release. At the bottom of the chart we also
use a volume based tool to alert us that this is the case. An easy +10
which displayed continuation.

Starting the Session +10

Chart attached below
 

Attachments

  • Pre-Open NY Session Trade.PNG
    Pre-Open NY Session Trade.PNG
    102.5 KB · Views: 8
Last edited:
And another "Leg 1-Leg 2" example again today

As mentioned previously, we prefer these entries as
they (2nd leg) provide the highest odds of success
currently. Traders should also notice that the skew is
(again) significantly positive, suggesting that institutions
have planned to move the market higher (for now).

As seen yesterday, after moving the market higher, the algos
activated and we saw an impulse move back down, reversing
all the gains. Professionals refer to this as "Pump & Dump"
with the late day reversal being the "Dump". And of course
it goes both ways ("Dump & Pump"). We teach the concept and
how to catch these impulse moves IF the trader is willing to accept
the risk and manage the position intelligently.

This will be our last post today

Good luck
 

Attachments

  • Leg 1-Leg 2 Example.PNG
    Leg 1-Leg 2 Example.PNG
    87.7 KB · Views: 10
Last edited:
Spent the previous evening testing Stochastics as a
possible tool that I can offer students who are having
difficulty making a transition to trading.

The testing part of the process was tedious (as it often is)
however after the data collection was completed, I learned that
a setting of 9,4,4 works very well and the results are considered
"Stable" from a statistical standpoint (meaning that this should
continue to work into the indeterminant future for this market).
As with all my tools, I test at intervals each weekend to insure
that the tools I use will continue to produce a profit).

This setup occurred just prior to today's NY session open
and resulted in a profit of +15 pts.

Postscript

I received a comment from a former student suggesting that this
worked primarily because of divergence. Ha, Yes they are right however
it's that kind of lazy thinking that will get students in trouble. You have
to remember that you are competing against the best. People with advanced
degrees in Math, Statistics, and Quantitative Methods. Divergence is only
part of the picture. Here is another piece of the puzzle

"Stationarity"

Showing stationarity (or at least ensuring the data is transformed to be stationary) is crucial for many statistical tests and models, especially in time series analysis. Stationarity implies that the statistical properties of the data (like mean, variance, and autocorrelation) remain constant over time.

I realize that for many of you, none of this is important, and THAT is why most of you lose. Eventually
if you want to make money in THIS environment, you will have to learn at least the basics.


Good luck
 

Attachments

  • Stochastic Example.PNG
    Stochastic Example.PNG
    49.2 KB · Views: 11
Last edited:
Readers may have noticed that my Charts are from TradingView
Because I have received a note from them (today) changing their
Terms of Service, I want to make sure that everyone knows that
TradingView is my service provider. All charts are by TradingView

Also since they make mention of restrictions on Automated trading
let me be very clear. I do not engage in Automated trading of any
kind, and I don't plan to in future. I trust my own hard won skill
over any automated system.
 
Here is today's chart using the system I created for Retail traders
Testing was completed today and I will go over the numbers this weekend
to evaluate the results. I believe it was "Adnan" who posted that his
testing showed good results. I fully expect mine to do the same. Although
emphasizing any single day result is foolish I am happy that today was
profitable.

The chart is by TradingView. The screen design is me. Choice of tools is
attributed to my mentor who asked to remain anonymous. The logic
of this "Simplified 1-2-3" system is my own.
 

Attachments

  • Retail System Screenshot.PNG
    Retail System Screenshot.PNG
    98.2 KB · Views: 7
I provide two (2) options for traders who may have trouble
evaluating price action on a 5 min basis
This chart shows 15 minute candles and is (for some) a simpler
way to trade. The tools remain the same, and the underlying logic
is similar. I won't be going into detail except to say students from
my first class like this, and found it easier to trade profitably because
(they said) there were fewer decisions to make

I also have to add, that for those who tried this option I suggested they
only trade after 2pm London time. Most of the time, that restriction seemed to get them
into the market at about the right time to catch a reasonable trend move, AND
it kept them out of the market at times when in past, they had given profits back
by overtrading.

Chart by TradingView
 

Attachments

  • 15 Min Screenshot.PNG
    15 Min Screenshot.PNG
    83.9 KB · Views: 9
Here is our Weekly Template for the previous week
This is also our starting point for the new week
Our planning begin process begins (Saturday)
and takes about an hour. We review the previous
chart patterns, and the pending economic news
for the next week. The basic trading plan takes
shape and revisions happen as necessary (as new
data enters the market Sunday through early
Monday)
 

Attachments

  • Weekly Template Example 2.PNG
    Weekly Template Example 2.PNG
    97.9 KB · Views: 9
It is 12:16 on the West Coast USA
and we are publishing two (2) examples of our
Weekly Review ("What Worked"). This is mandatory
for our Class and provides a point of reference for
students who want (need) to know more about
1) How the system provides opportunity, 2) how
the setups play out when traded in a disciplined
way and 3) System Status (what percentage of valid
setups are working currently). This is critically important
for struggling traders, who need to see results ASAP.

Day 1 is a trend day example. Day 2, a trading range example

Postscript

The "Trading Range" example deserves additional comment as follows

First, traders should understand that it is more likely for a market to open
by exhibiting "Trading Range" behavior, than "Trend". These are the basic statistics.
Therefore it is more important for traders to learn recognize to this type of price action
because they will see it more often, AND it is even more important for them to learn
to stand aside (at first) until they obtain the skills to trade with precision, AND not to get
chopped up early on, and have to spend the rest of the session "getting back to even".
I can't stress this enough. If you are new to trading, stand aside when you see the first
several bars overlap each other, with prominent tails. Wait patiently for the market
to breakout. If you just wait and learn how to recognize a valid breakout, this alone
will provide a way to go from being a net loser, to what one author has called "Winning
the Loser's Game". What I hope my students learn is that success is about learning to
make good decisions.

Good luck
 

Attachments

  • Day 1 Weekend Review.PNG
    Day 1 Weekend Review.PNG
    91 KB · Views: 5
  • Weekly Review Tuesday.PNG
    Weekly Review Tuesday.PNG
    108.6 KB · Views: 8
Last edited:
Finally, another critical element of becoming a profitable trader
is to be able to determine which side is "trapped". Notice that
we do not refer to "trapped traders", but instead use the term
"trapped volume". Why? Because most of the volume is computer
generated algo driven. There are limitations to what even the best
programmers can achieve, and that is in part why this continues to
occur.

Knowing how to identify "Trapped Volume" helps to create a more
accurate daily trading plan.

Good luck
 

Attachments

  • Identifying Trapped Volume.PNG
    Identifying Trapped Volume.PNG
    147.7 KB · Views: 9
This update of the Weekly Cycle is important because high impact
news hit the market. Specifically, President Trump decided (again)
to postpone tariffs on Euro Countries. Looking at the chart, readers
can see the WRB on the right side followed by smaller bars that move
up to test a prior S/R line. If you scan to the far left, you can see that
the price that is being tested (repeatedly) is the previous Thurs NY Open.
Looking carefully at the chart, readers should be able to see the various
prices where bulls have tried to scale in to reverse the market higher.

During the next Asia and London Session, we expect institutions to attempt
once again to move markets higher.

Good Luck
 

Attachments

  • Memorial Day Holiday Update.PNG
    Memorial Day Holiday Update.PNG
    132.2 KB · Views: 7
Hello Readers

Here on the West Coast US, it is 12:20am and the London
Market has just opened. As mentioned in the previous post
we expected that the market would attempt to move higher
based on recent news (also covered previously).

As traders review the attached chart, notice that the
red line (the POC) is below the white (AVWAP) confirming that
the statistical skew is positive and so we took the trade. We have
taken +10 and left a runner in place, with an overhead target of +20
and a stop loss at breakeven.

Good luck
 

Attachments

  • Trading London Open 2.PNG
    Trading London Open 2.PNG
    125.1 KB · Views: 5
12:30 and price hit our +20 target, so we are out
We will get some sleep and be ready to go in the morning
when the NY session opens
 
7:35am on the West Coast US and the market continues
to move higher on favorable economic news

As easy day to trade +20
 

Attachments

  • NY Open.PNG
    NY Open.PNG
    70.6 KB · Views: 8
I was asked "how can I know when to hold for a swing, and when to scalp?
The answer is actually simple. It is all about the time of day, the way the first
three (3) bars look (strong or weak), and then you factor in the "news".
The best time of day to swing trade is the first hour. The way the first three (3)
bars look is critical. If they are trending, with very little or no overlap and either
small or no tails, then you have a potential trend. AND once you get filled you
monitor the close of each bar, again, does the bar close strong or weak?
The bottom line is that you hold a profitable position as long as each bar closes
strong, relative to the black line.

Notice also, that when the NY session opened, it moved below the Low of the London
session, but then buyers came in to "lift the offer". When you see this, you buy and you
hold as long as possible.
 

Attachments

  • NY Session 5-27.PNG
    NY Session 5-27.PNG
    91.5 KB · Views: 10
Last edited:
Hello from West Coast US. where local time is 7:55am

For readers of previous posts, this chart speaks for itself
A negative skew develops shortly after the open, and as
usual, price opens up, then reverses taking out a significant
S/R level. The short entry is obvious, and the short results in
a profit of +10 quickly. Skilled traders would have taken +10
holding a runner for +20. A typical trend day reversal off the open

Good luck
 

Attachments

  • NY Session 5-28.PNG
    NY Session 5-28.PNG
    78.7 KB · Views: 7
Back
Top