A Professional Approach to Trading Futures

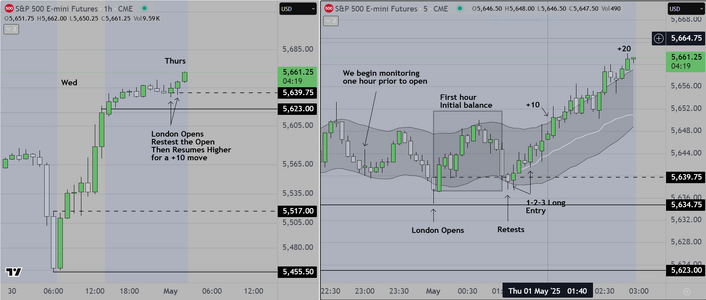
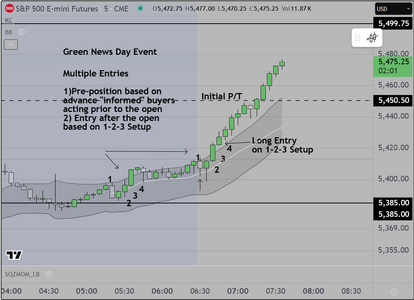
Today was a "Green News" day, meaning that we had
several "high impact" economic news events happening
and (in our opinion), "other" time frame participants had
advance knowledge of the outcome and had pre-positioned
themselves in the market, to take advantage of the move up

We teach this. It's straightforward, and only requires that students
pay attention to the obvious human behavior. We show traders
how to find the "tells" which are based on price action and volume
(or momentum). Then they learn to create scenarios based on
what we call "confidence levels".

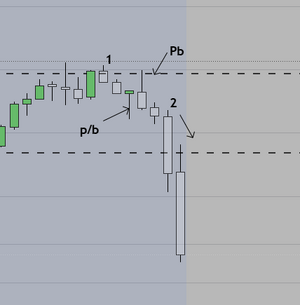
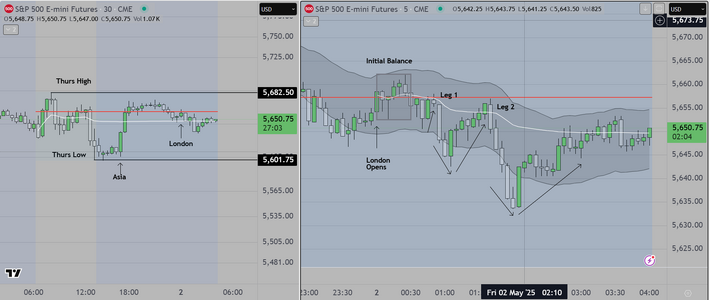
In this case, the scenario provides two options. The trader can if they
wish, pre-position along with the institutions, then if the trade is working
they take partial profit early (called "buying a stop") and they hold a
"runner". This requires that they trade at least two (2) contracts. OR

They can simply wait for the formal open and take the 1-2-3 setup with
long entry on "4".

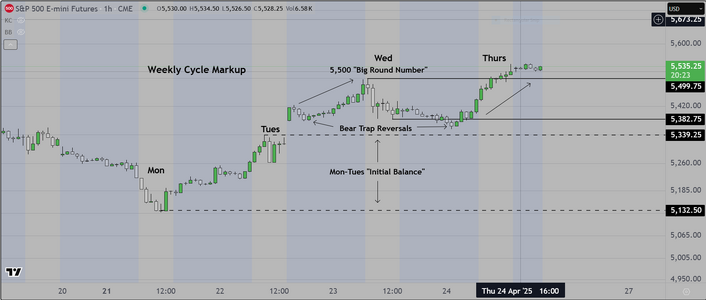
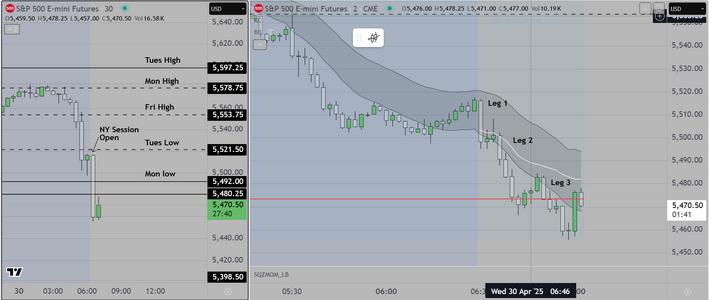
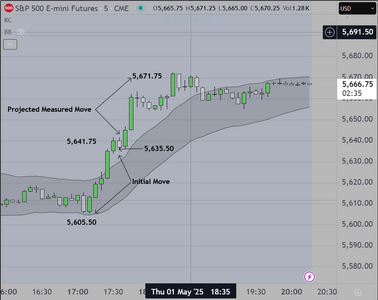
The attached markup shows the entries. We did not take the early entry
(we were sleeping) but it is often the case that when we do the preparation
for this day, we get up early to participate in what we were taught to call
a "Green News Day Event". Obviously an overhead profit target was hit.

Postscript

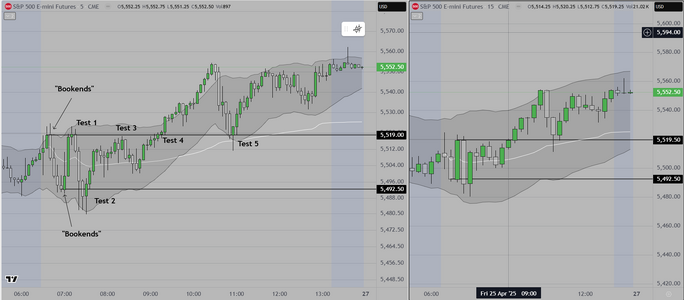
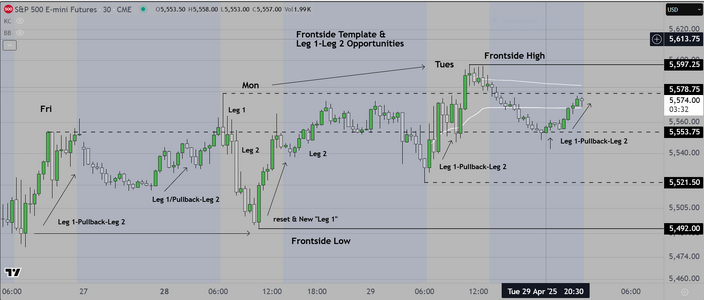
We had to clean up our chart, to better show the opportunities
We have said this previously, "nothing works all the time" however
this type of logic based trading does work quite well if one commits
to and maintains the discipline. The results certainly speak for themselves.

Good luck
 

Attachments

  • Green News Day.PNG
    Green News Day.PNG
    90.5 KB · Views: 24
Last edited:
We attach an example chart, showing the weekly cycle to date

The operational benefit is significant, provided a trader can learn to
think along with/get aligned with the way the institutions work

What Happened this Week

1) Monday/Tues form what is known as the "Initial Balance". In a trending market
one of the extremes will usually hold. Also, professionals know that the odds favor
trading "with" the trend once it is identified.

2) After the initial balance is created, we saw a "gap up" created by economic news
From that point forward, institutions favor the long side, looking for a test of the "BRN"
(Big Round Number). Skilled participants will look for ways to get (and stay) long.

3) Institutions are always ready to capitalize on news events, and so they sell to create
"bear traps" hoping to entice traders to sell, then they activate stops and reverse the market
leaving short sellers "trapped out" of the reversal back to the ultimate profit target (5,500)
This strategy worked twice this week as seen on the attached chart..

As we have said previously, traders who prepare by looking at these 30 minute charts prior to
each session have an advantage, in that they can see, what is happening. Once they identify
the underlying logic, it is relatively easy to wait for the next setup and "go with" the institutions
as they move the market to toward the BRN (big round number) at 5,500

Good luck
 

Attachments

  • Weekly Cycle EXample 3.PNG
    Weekly Cycle EXample 3.PNG
    94.9 KB · Views: 15
Last edited:
Although I may return to address questions, this will likely be my last post

The attached Markup shows a dual screen with 5 min candles on
the left and 15 min candles on the right.

The emphasis is on providing retail traders with 1) a way to frame
the price action, so that they can 1) determine where price is going
and 2) find a reasonable entry that can be managed to a profitable
exit, OR on the occasions when they are wrong, they can 4) identify
that they are wrong quickly and 5) Minimize the loss or even reverse
and turn a loser into a winner. This is what it's all about.

The Tools

To that end we provide a system that uses Keltner channels as the basis
We use AVWAP (Anchored VWAP) as a "Key Reference" and we add our
own additional framing technique ("Bookends") that allows the trader to
identify conditions (Trading Range) that usually cause retail traders to
lose money EARLY in a session. These tools, when properly used, allow
the struggling trader to turn things around by quickly (first couple of candles)
identifying what the conditions are, and then applying the right decision making
process to 1) Avoid or minimize losers and 2) Take statistically good entries
The statistical basis is covered by use of FRVP (Fixed Range Volume Profile)

The chart view on the left (5 min candles), shows "Tests", based on the initial placement
of "Bookends". Once the Bookends are in place, the trader chooses how to react when
price returns (to create the test). Early in the session, the odds favor "trading range" behavior
and so a skilled trader would know which side of the trade to take. Later in the session
again the skilled trader knows that price is likely to test and then breakout (higher or lower)
and again they choose based on general rules that we demonstrate effectively.

The chart on the right shows 15 min candles and this is all about visual appeal. The trader takes
fewer trades, however those trades tend to be easier (for struggling traders) to identify, and
quicker for them to "break through" and make a profit.

Final Note

During our training, we add the final piece of the puzzle, which is HOW TO THINK
ALONG WITH INSTITUTIONS, and HOW TO UNDERSTAND THE BASIC WEEKLY AND
MONTHLY CYCLES THAT DOMINATE THE MARKETS CURRENTLY.

Good luck
 

Attachments

  • Dual Screen Example.PNG
    Dual Screen Example.PNG
    125.4 KB · Views: 9
Last edited:
I received several questions regarding the use of "Skew"

I summarize as follows

The skew is the difference between the red line (volume profile POC)
and the VWAP. Both are tools that commercial traders rely on for various reasons
AND commercial trading firms use the VWAP to evaluate each trader's performance

When the red line is below the VWAP (represented by a white line) then it is positive
and when price is AT the VWAP, statistically the expectation is that price will move higher
Conversely, when the red line is above the VWAP, then it is negative, and when price is AT
the VWAP, the expectation is that price will move lower. For those without the math background
this is probably difficult to understand. Basically it is about price moving from areas of low volume
to areas of high volume (and vice versa). IF you think about this, it means that when price moves
from an area of high volume to an area of low volume, it is trending. When price is moving from
an area of low volume an area of high volume it is usually in a trading range.

What we as traders want is to know which condition is occurring in time to "catch" the trend and I
assume that readers understand, that you want to NOT to trade in a trading range, because that is
where struggling traders get chopped up and lose money. I am tempted to say "its simple" but
of course one has to learn how to use the tools.

The attached chart shows today's example prior to the open of the London Session. This trend move
up happened as the red line moved below the white (VWAP) and when it did, I put on a trade knowing
that the statistics indicated a favorable trade.

As I have said previously, I am very selective, I want to take only trades where the statistics are in my favor
AND when those conditions are met, I want to hold my position for at least +10 points, often taking partial
profit there, and holding a small position to run further.

Absent further questions, this will be a curtain call.

Good luck

Postscript

Readers should note that I made an error in typing my definition of "Skew"
The objective is to determine when price is moving from an area
of high volume, to an area of low volume (trend), and to stand aside in all
other conditions, so as to limit loss. Its that basic, maximize profit, limit loss.
 

Attachments

  • Example of Skew Transition.PNG
    Example of Skew Transition.PNG
    124.6 KB · Views: 8
Last edited:
And here is an example of "Negative Skew" as traders take profit on the previous long
trade

I missed this trade, because I was posting, and this is in part why I am stopping. The
position of the red line vs the white (VWAP) is clear, and the short entry is below the
white line. Again (and for the last time I hope) this is about learning to use the tools
and then executing in a disciplined manner.

Good luck
 

Attachments

  • Negative Skew Example.PNG
    Negative Skew Example.PNG
    67.7 KB · Views: 11
Another question, ironically from a person in my first class, with regard to Cycles

There are all kinds of "Cycles", promoted as the "End-All, Be-All" and thought to represent
some useful purpose. I don't claim to be an expert. I was taught a basic concept and
my only concern is "does it help me to make money". This accomplishes that objective.

Weekly Cycle

Institutions and 2nd tier commercials look at the market in terms of a weekly cycle. This cycle
has a "Frontside" (Monday through Wednesday) and a "Backside" (Wednesday through Friday).
Friday is considered a transition into the next cycle.

Based a quite a bit of testing, I know that all markets move in "Legs" and further, that there are
usually at least two (2) and usually three (3) legs in any market session (unless it is a trading range
in which case the market is stagnant and moving sideways).

Knowing this, we look for a way to 1) Identify the "First Leg". We do this by timing (time of day primarily)
and by price action over various time frames (we prefer 15min and 30 min candles). We can trade the first
leg, however the real money is usually made during the second leg, and that is where we want to accept risk
find reasonable entries and manage those positions so that we make as much money from those trades as
possible. In general we want to stay out (stand aside) from the third leg, because statistically it is less reliable
and more volatile.

The bottom line is that a skilled trader can make a living (a very good living) trading only "2nd legs" as long as
they don't give it all back, trading the 3rd leg. In terms of creating a sustainable business model, we advise
retail traders to specialize in trading only "2nd Legs". The basis of our next class will be teaching struggling
traders how to go from losing, (by trading "everywhere and anytime") to only trading once they identify these
2nd leg opportunities. We teach them to look at this as though they owned a factory making widgets (lets call
them "2nd Legs"). They have a specific method that they follow to make these widgets and they do it very well.
They manage this business like any other, and if they do it with discipline, they find that they are rewarded.

The person who asked this question (let's call him "Chris") decided that he would simply trade all session long
taking every setup. Why not? The more setups the more potential (if your system works right?) No, not right
Again, ALL trading is about maximizing profit, minimizing loss. To achieve that goal, one has to FIND a statistical
edge, and learn to exploit it. Retail traders can find it for themselves OR they can look at this and decide for themselves
whether it is worth the risk. I have made a living trading this "edge" for close to 17 years.

Chart attached below

Good luck
 

Attachments

  • Frontside Template Example.PNG
    Frontside Template Example.PNG
    120.3 KB · Views: 8
Last edited:
Enjoy the thread steven. Don't agree with all of it 🙂 but I think there is a lot of value in your posts.

Sometimes I find some of your comments a bit 'vague', but that is probably that you have your own mental model of the markets, and you understand exactly what you mean, but for another person, it can be hard. For example the 'legs' you mention and the charts you posted, they are a bit hard to understand/identify in the moment. Subjective. Other times you have posted very clear instructions, so please don't take this post as a criticism.

As you mentioned there are lots of cycles. I remember an old poster on these forums who was making use of the Taylor trading method, a Buy day, a Sell day, a sell short day. Somehow he made it work, but was a mystery to me
 
Last edited:
George Douglas Taylor

In the preface to his book "Taylor Trading Technique" cica 1950 he states in the preface

"While the statements in this book are predicated on fundamentals, no reader should accept them as hard
and fast rules. Without exceptions, statements that have been made are based upon long periods of observations
of what generally works........."

If you are looking for entirely objective rules to trade by, you will be waiting a long time. This was my mentor's comment
(and Dr. Al Brooks as well If memory serves.)

Early on when I started my two (2) threads, I suggested that readers obtain a basic understanding of Statistics & Probability
A person who has that basic background knows that what matters is whether over a statistically significant sample size, there is a
tendency for something to occur. Every skilled professional I know embraces this as the basis for their success. They know that nothing
(no rules, no indicator, no cycle) works all the time.

My recommendation to struggling traders is to make incremental improvement in a number of areas, to be disciplined and document
their actions, and to be honest with themselves. In my view, success is about minimizing bad decisions, and making the most out
of good ones.

Good luck
 
All good stuff steven. Agree with most. Why are you not continuing the thread?

I don't actually believe in objective rules for trading, I think it should be subjective. To a point. Some rules need to be objective. The Risk management for example, the Stats & Prob concept you mentioned.

I was trying to say, that for educational purposes only, objectivity is useful for understanding. I can understand the concept of legs/movement. I can understand there could be a Mon-Fri cycle. But I can't see what you are highlighting exactly or how it can be used. As I mentioned, you have your own mental model and understand exactly what you see, but from someone without that, it is not clear. Is my comment fair?
 
My home was burned in fire and had to be rebuilt. I am doing that myself and it is
keeping me busy and unable to continue to work at my profession and post here.

A "leg" is a series of consecutive bars or candles moving in one direction. If you allow
for a bit of wiggle room, that might include doji's and borderline bars or candles that
almost fit that definition. Also it is important to decide what time frame to analyze
Some people see a leg more clearly when the bars or candles are on a higher time frame.
And finally, on shorter time frame it is general direction of bars or candles that matter most
when identifying a leg. If it is difficult for you to work with, it may not be the appropriate
tool for you to use. I have mentioned in past that many professional traders use "footprint"
charts and they read order flow. No need to identify legs there. You have many options.
 
This is a reasonably good example of how difficult it can be to learn to identify
legs.

In this chart we have a two candle first leg, followed by a candle that is called a doji
The next candle displays a wick at the top, indicating that the pull back continued for
two candles up to the dashed line. This pullback divides the move into two (2) legs.
The first leg has a number "1" next to it. the pullback is notated but can be difficult
to understand because it consists of two candles. Then price resumes its movement
lower creating the 2nd leg. This is a very high odds of success move (that I missed
while posting). Not a big problem for me, but a real life example of why I am not
continuing much longer.

Hope this explanation helps

Good luck
 

Attachments

  • Pull back Example.PNG
    Pull back Example.PNG
    7.4 KB · Views: 4
Last edited:
And a final example from this morning's S&P Futures Open

This should be easy to follow

Everything is lined up about as perfectly as it can be
price action is obviously to the down side
economic news was red (bad news)
Statistical Skew is to the down side
What else can I say
You take the trade, you exit one unit at +10 and
you wait for the second to hit +20
If it does not continue to +20 you exit and you get paid.
End of story, move on to the next trade.

Good luck
 

Attachments

  • Full Screen.PNG
    Full Screen.PNG
    123.9 KB · Views: 4
Last edited:
Back
Top