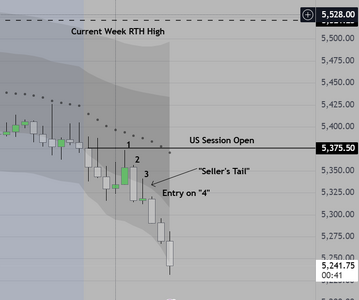
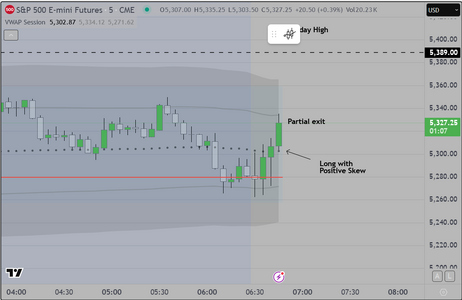
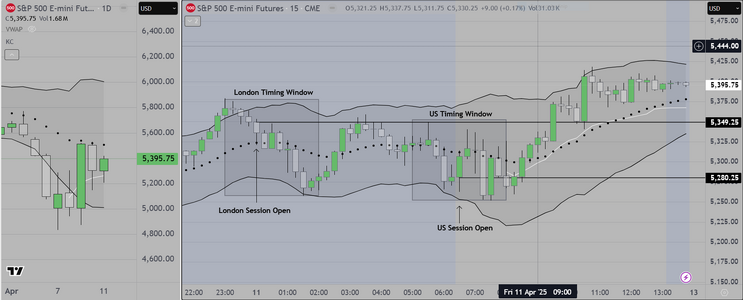
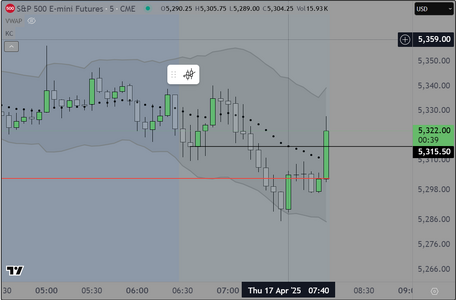
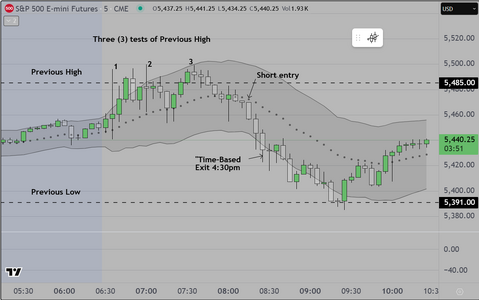
This is our pre-market chart for the NY session of S&P500 futures
Again our emphasis is on simplicity and placement of data that is useful
It assumes that the trader/operator is retail and so does not manage or
have oversight of an automated program. This means that we look for
trades based an understanding of the importance of cycles. We start with
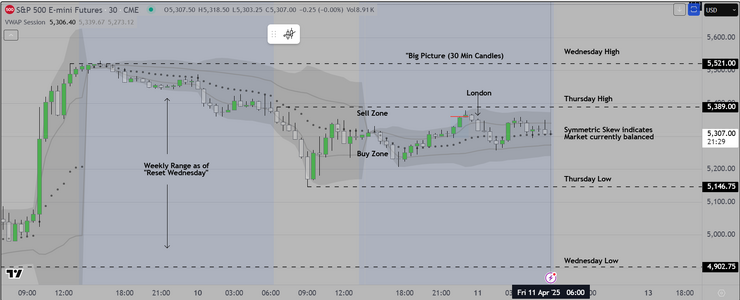
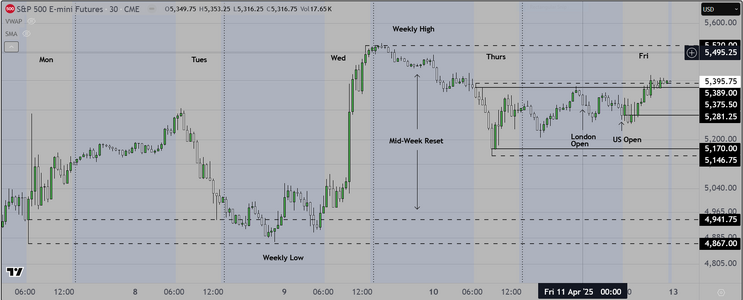
the weekly cycle, which for us is
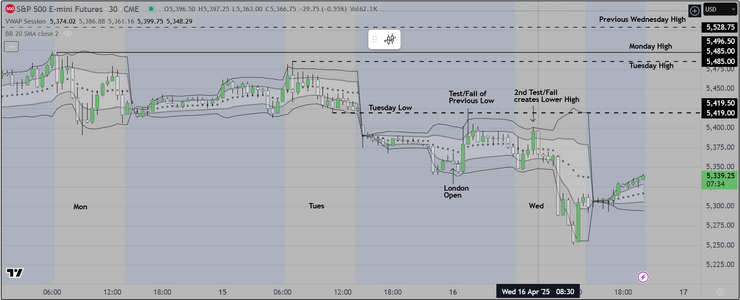
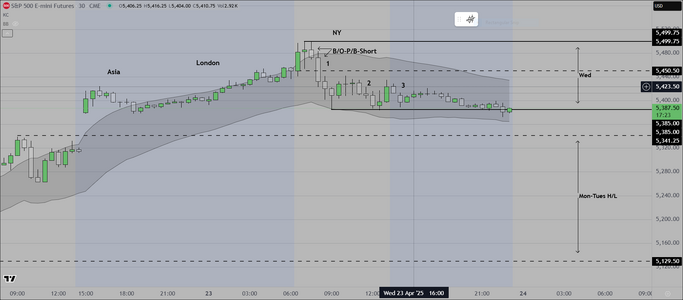
1) Mon-Tues, forming the "Initial Balance"
2) Reset Wednesday, which is the bridge (the frontside of the cycle) and
3) Thursday-Friday, which represents the completion of the cycle
We assume that most volume is generated by "Other" time frame participants
and that we are at a disadvantage as regards information, and the ability to
scale in/out at will. Therefore our strategy is to monitor and operate within
time constraints as follows
1) Asia 1pm to 4pm London
2) London 7am to 10am Local
3) NY 1pm to 4pm London
We believe these hours represent relatively "safe" time periods in which to look
for, structure, and manage, a successful trade, without having to deal with automated
stop runs and "sweeps". That can change but for now this is our best information.
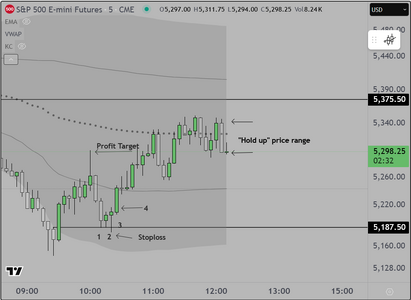
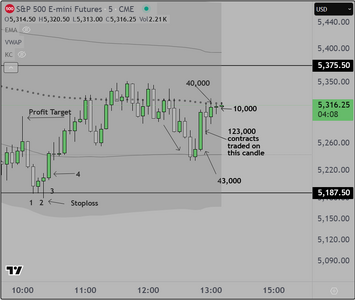
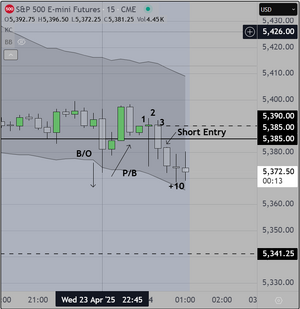
We train retail and non commercials to choose either a scalping system or a swing system
The scalp system can use 2 min or 5 min candles, the swing system uses 15 minute candles
either way the end goal is to create a sustainable business model that allows a disciplined
trader to be successful, if they do the work.
Most retail traders go into a session with no idea where the markets will move, and no real plan
as regards how they will find a trade. Essentially they are guessing, which is why they invariably lose
We start our preparation with the following simple rule set and elaborate as we run through our
pre-open preparation. Here is simplified version
1) We start with Daily and Weekly charts. We assume that the price action on these charts is going
to be either "Trend" or "Trading Range"
2) If "Trend" and that trend is up, we assume that the session will close above the open. That means that
we will watch the open and if it displays an initial move lower, we wait for failure of that move and buy
the reversal up, taking partial profit at the open, and holding a runner, assuming that the odds favor
continuation (and vice versa for the short side)
3) If the Daily/Weekly charts display "trading range" and price is currently in the upper third of the range
we assume that during THE NEXT SESSION, institutions will want to sell the market back down into the range to
accumulate inventory, which they will later mark up and distribute at higher prices (and vice versa for the
opposite side).
This is the basis, and we elaborate on it by incorporating a review of Pending Economic News, among other
things
I think this is plenty for traders to consider, so we will leave it at that. As mentioned previously these will be our
final posts, and then we will consider having an "open house" Zoom where struggling traders can see the process
"live", and apply for a place in the class if they wish. Our first class consisted of 34 participants. We would hope to have
not more than 20 this time.
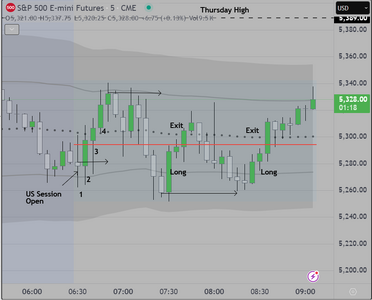
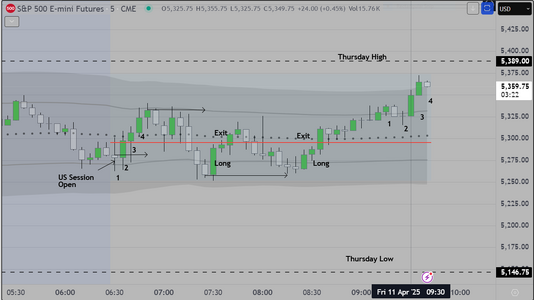
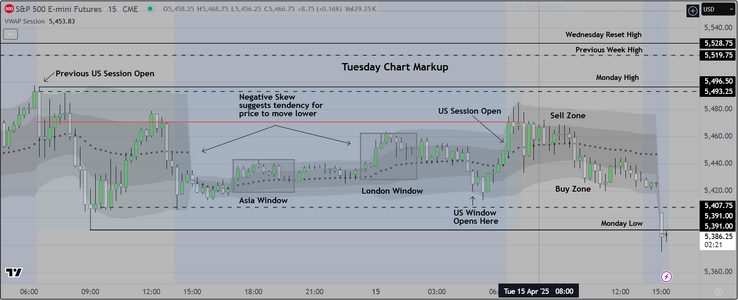
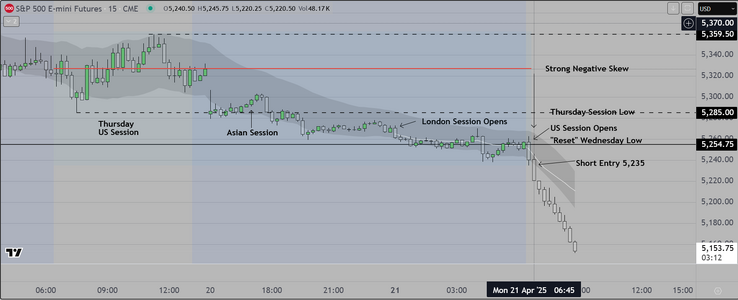
We attach the markup chart for the NY session
Postscript
I tend to be pessimistic about this venture. If traders were really interested in learning to do this, one might imagine that they
would look carefully at the markup chart and notice that price traded up, taking out the Mon-Tues "Initial balance", THEN at the open
of the next session, institutions did their best to trap traders into thinking it would continue, but instead they sold it down
and the market closed below the open of the session. What a coincidence.