A basic, easy system that works for me

SKJ

Newbie
Messages
6
Likes
0
As my first post here, I'd like to donate a trading system for TradeStation that I have been using since November last year. I use this for trading index futures intraday. It worked well for me on the Nikkei, but I now use it on another index (which I dont really want to name.)

Its basic, very basic: Sell a contract at the current high of the day minus X points.
I.E, when an index is down X points from its high, it will have high chance of going down X number of points further. Obviously a market is more prone, especially in these times, to undergo a wave of panic selling, than a wave of panic buying. This takes advantage of this.
This system works well in a downtrending market - heh. It includes a break-even stop, and the sell level should be optimized for the market. I now watch the direction of the Asian markets before I take this trade, I.E. if both Nikkei and Hang are up, a lot, I wont do the trade. Anyway...I'll leave it up to you....

(Sorry for those who dont have TS)
File is all of 4 bytes.
 

Attachments

  • r-seller.zip
    3.6 KB · Views: 826
Thanks for that.
Have to say that the Nikkei at the back end of this year is probably the best trade I have EVER been involved in and I have been trading for 14 years.
I bought the break up from the inverted SHS on weekly chart at 12410 and have been in it, long, ever since. Hit 16000 this morning!!!
Go Nikkei!!!
 
Last edited:
What are settings for the system you posted please.
 
Another Christmas Present

5 min chart es all sessions.
Change file from .doc to .ELD and execute to import into TS.

Comments from TS users welcome.
Do you know how simple this is?
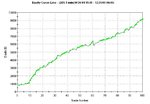
Equity curve based on 1lot trades.

--------------------------------------------------------------------------------------------------------------------------------
I do not make any guarantees to anybody who may decide to try and trade this, you could really lose your **** and more.
I post for entertainment purposes only.
 

Attachments

  • es5min.doc
    24.1 KB · Views: 875
  • es5min.jpg
    es5min.jpg
    41.3 KB · Views: 775
I only have 2000i so cannot import this format.
Can you export it in ELS or ELA format?

Congratulations on the Nikkei trade.
 
twalker,

Given the original post was in March '03 it looks like you've done a true walk fwd. Did you tweek the parameters for ES?

As you've had such a good run on the Nikkei can I send you my Xmas list? :cheesy:
 
Thanks twalker - that may turn out to be one of my better Christmas presents!

It seems to be buying the close of a down day & then selling just after the following days open (or something along those lines). It's been working well since the bull run started around Spring '03, but poorly prior to that - I presume you've tried the opposite entries too?

The results are also good on the other US contracts (particularly ER2 & EMD). Is there any chance you can let us fully 'unwrap' it & see the code?

Cheers
Simon
 
twalker said:
Thanks for that.
Have to say that the Nikkei at the back end of this year is probably the best trade I have EVER been involved in and I have been trading for 14 years.
I bought the break up from the inverted SHS on weekly chart at 12410 and have been in it, long, ever since. Hit 16000 this morning!!!
Go Nikkei!!!


Congrats twalker, superb move!!

I got in myself albeit a bit later at 14045.

I haven't got the charts to hand but if I remember my analysis correctly we could be looking at a return to the 20000 mark from 2001ish... :eek:
 
Last edited:
It is not possible as the files are protected code. Anyway the r-seller thing doesn't appear to trade at all.
 
Top