User
Experienced member
- Messages
- 1,170
- Likes
- 23
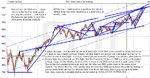
Weekly Close Above 12000......
Is that because we going higher and higher and higher......?
Nope
Its just to get more suckers in before the plug is pulled......
😈
Those of you that don't believe it......
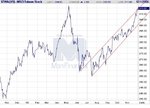
Well not many believed it in 2000......
Nor did they believe that the market was tired of downside in Oct 02 and Mar 03
Oh Well
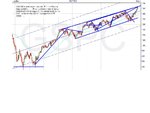
Have a look at the Weekly chart interpretation I have attached.
Good Luck
Is that because we going higher and higher and higher......?
Nope
Its just to get more suckers in before the plug is pulled......
😈
Those of you that don't believe it......
Well not many believed it in 2000......
Nor did they believe that the market was tired of downside in Oct 02 and Mar 03
Oh Well
Have a look at the Weekly chart interpretation I have attached.
Good Luck