1-2-3-Formations and Ross Hooks

Pratbh

Regarding your question concerning 123 & the RH with the examples you have displayed.

First I do not follow the RH specifically but I do trade from price alone so our methods are very similar. As with all trading methods they do not work all of the time so you have to be ready for this.

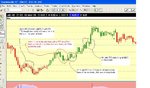
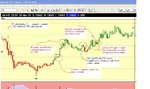
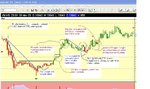
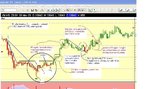
When trading you have to have a complete trading plan and with that comes the confidence to know what you are doing and your intent at any time. From your chart example there is insufficient data. Are we dealing with an intraday position or something from the daily. On the basis of the price bars you plot then it would depend what the overriding trend was for the time-frame you display. Therefore if the trend is down you look for a secondary failing to enter a sell or a break of the trend itself according to your style. But on this thread applying the TTE approach then you would look to sell before the relevant point. If it was an uptrend then you would be looking to buy in a similar fashion.

So the answer to your question really is you need to define what the trend is at that time and focus on that and apply your trading method to it. If the position does not meet your requirements then you stand aside and wait for a better or clearer opportunity. The method is everything.
 
pratbh

Agree with both your points, in essence what we are looking for with a TTE is to come out with a very small gain even if we are wrong.

If we trade a RH with a TTE we want a fill by no more tham 3 correction bars, after this we have to bear in mind that the chances of a continuation are greatly reduced.
 
pratbh said:
Quercus and OES:
Thanks for your replies. I've been thinking about this and yes, now I understand it (I think).

The decision process:
=================

1. When a trend is underway (a trend that started with a 123 or a ledge breakout) we have to assume any correction is a pullback and not an impending reversal. The first pullback that occurs in a trend since the 123 breakout will be traded by RH. We won't even consider trading with 123.

2. If the trend indeed does continue, the RH trade will be successful. If not, the market might be reversing or we might be moving into a congestion, or it just might be market noise etc. We will wait and see if a 123 pattern forms on the opposite side. We will then trade the 123.

Is this a sensible approach?

Nope, I am just kidding myself. I am still confused as hell. Nowhere does JR says in TTRH that we have to assume only the first correction since the beginning of a trend is a RH. In fact he says, once a trend is underway, you can trade every single RH. Which brings us back to the original question, how does the same person trade both 123s and RHs on the same market? You can't, not without using additional filters. Either you are a trend continuation man, or you are a trend reversal man. You cannot be both at the same time.

Roberto, are you around? You trade these for a living. What's your opinion?

PS. In fact I am stopping my work on the notes, until I understand this fully. This is fundamental.
 
Pratbh

I don't know if this will help. I started to trade from pivots alone in line with the trend of the time frame I was trading which tended to be intraday from a 5 min chart. I worked with price only looking for support in each new trend. Not all signals worked and I found that although there are several pull backs in trends the further you enter away from the trend change signal the greater the risk of failure.

Then I found the Ross Hook literature which I found extremely interesting as it deals with price in its purest form. However I found with my own research that it is not good to just follow a trend blindly but to have a selective approach. For example you could get a Ross Hook and break-out that is only a correction of the larger trend.

I have found that since I turned my back on indicators and focussed directly on price action I remain more aware of price development and acceptance. I am better prepared to see how a trend will unfold and what to look for in the early stages of a trend change signal. The Ross Hook is another filtering entry method because it is certainly not an entry method that gets you in close to the start of a new move. But it is a defensive trading method that tends to keep you trading in line with the trend so IMHO it is a good method.

However it is not the Hook or TTTE that gets my main focus but what is the trend and when the trend appears to change where does the price pull back to in this first move to establish if the change of direction is worthy or not. Only when I see the price take out a previous price bar support from the previous trend do I then consider an entry on the next support which of course will be like a TTE entry but not a true trend change signal with point 2 being taken out. If the previous support is not taken out then I continue to trade in line with the trend but realise that this trend is being challenged and the move could be coming to an end. Eventually you will get the price trend break followed by a move against the existing trend and then a retracement before a bounce up in a new up trend or a push off in a new down trend. For this I use an extending trendline which helps to confirm the new trend. Then the TTE can be applied. Please be aware that my comments relate to applying this on a 5 min time frame on the FTSE and you have to discover the system that bests suits you own personality and the instrument/s you are most comfortable trading.

If the Ross Hook system is causing you problems and you cannot get over this after a reasonable time then it maybe this system does not suit your own trading psyche. The most important aspect of your trading is finding something that works for you and as good as another's system maybe it is what you have confidence and the ability to trade that matters most in order to progress.
 
An example of what I was trying to explain although chart is from the daily time frame it can be broken down to shorter time frames to confirm the entry points I have displayed adapting the RH method.
 

Attachments

  • RH & TRENDS WITH 1-2-3 TTE.GIF
    RH & TRENDS WITH 1-2-3 TTE.GIF
    28.9 KB · Views: 1,019
Did not come out very well, see if this is any better
 

Attachments

  • RH & TRENDS WITH 1-2-3 TTE.JPG
    RH & TRENDS WITH 1-2-3 TTE.JPG
    123 KB · Views: 1,073
Another question and I accept I may not have fully understood the Hook concept. I have attached a previous chart Roberto was kind enough to display. I have included the original 1-2-3 formation that was previously identified and have updated the position of the Hook as I understand it.

I have then illustrated what I believe is the 'Traders Trick Entry', that area where the price trades between the Hook and the resistance to the trend supporting the Hook signal. In the example that would mean selling between 1306 and low 1304.

This is an intraday chart and I wonder how affective this style is for the shorter time frame. We are all aware that if day trading we are playing with smaller points and therefore entry becomes far more important. Unless you adopt a method where you are obtaining a high win % but taking low points in order to establish a win this method may not be as productive on all instruments IMHO. Clearly this method like many works best during trending periods because it is getting you into a trend late. Therefore what would appear to be important is the character of the instrument as to the success of this method both in terms of the trading range regularly seen and the trending or non trending state. In the case of the FX and US markets this would appear a very good system but on slower instruments I am not so sure. For this reason IMHO I feel this system is better suited to longer positions such as trading the daily time frame. Moreover it can be a style that does not require you to sit in front of your computer all day as one has to when day trading. While the use of the Hook or even the Traders Trick Entry can provide data where orders can be placed in the market at these levels in advance of waiting to see it appear on your screen so it can be an end of day system with an appropriate stop.

I have added a trendline to the attached chart which displays a break of the bar trendline at approximately 1306, this is followed by a lower high at 1307. Some would argue that the trend change confirmation signal is not seen until point 2 is taken out for the 1st time or when the price retraces back towards this line and fails underneath it for a 2nd time. Point 2 being high 1305. However for the purpose of intraday trading and tighter stops an entry in the region of the lower high would offer greater potential and is a selective approach based on the break of a trend with daylight between the top and subsequent failure. An entry to sell around low 1307 benefits more of the fall and is taken at an early stage when the momentum of change has a greater probability of providing something for your trouble IMHO. I am talking purely of day trading in this particular aspect.

I have posted this here for someone to point out where I may have gone wrong in my understanding of the Hook and or Traders Trick Entry. Having considered this method paper trading it on the FTSE while I continue my own method I have come to the conclusion that for day trading either from the 5 or 15 min the FTSE is not a suitable instrument for this method or that the entry position lags to far behind for everyday use. It is for this reason that in the case of the FTSE I feel it maybe better suited to longer positions where the FTSE has seen trends over several days. The return using this method on day trading has been less than applying a simple trend change strategy.

I have not posted this to antagonise anyone who strongly supports the Hook method but to offer it up for analysis and further discussion. When I first found the Ross website and the law of the charts article I was and am still impressed as it works very closely to what I have been doing and I prefer to work with price in its simplest form alone but for trends, trendline & extended trendlines, pivots support and resistance.

Regards

Kevin
 

Attachments

  • eur-$-30min-25-1-05.JPG
    eur-$-30min-25-1-05.JPG
    47.4 KB · Views: 865
Kevin546

Accept your point entirely that the instrument traded is the key to using this style of trading intra day, I only trade 2,3,5 min time frames on US currency and index futs.

If spread betting intra day on UK stocks/index it will prove difficult.

IMHO this style of trading is just as well suited to 1 min charts as it is to weekly, I can't agree that it is better suited to longer time frames as these patterns just keep appearing time and time again.

The style, entry and stop levels are all relevant to our own experience and skills but the basic structure of the patterns, irrelevant of time frame remain constant.

Also don't agree on your point about a RH getting you into to the trend late, I have always found a RH+TTE to get me into the move very early.

The point of a TTE is that with market depth we only get to see the orders that are stacked up behind us, the key to how far a move will run is the number of buy stop/sell stop orders in front of us and only insiders get to see this info, all we can assume is that orders are going to be stacked at the #2 point of a 123 or at the hi/lo of a RH, if we are in the market a number of ticks ahead of these points even if there are not enough orders to carry price past this point of support/resistance we come out with a profit.

It is my opinion that 123 / RH traded with a TTE gives us a low risk high probability trade, take out the TTE and I would not consider trading any of these patterns on an intra day time frame.

I have marked TTE entries for 123 and RH as I see them, I think we agree on the first i.e.a breakout of the low of the bar preceding the bar that made #3 high, however don't think we agree on the RH TTE I would be short on the breakout of the low of the subsequent bar to the RH.

Also there is a failed RH in the bars subsequent the #1, I have not checked previous posts to see if this has already been pointed out, however if that failed pattern had been traded using a TTE then it looks like you could have got away with a b/e or 1-2 tick gain.

Not antagonised in any way at all, as long as there are opposing views with entries and exits there will always be a market :cheesy:
 

Attachments

  • 123p.JPG
    123p.JPG
    54 KB · Views: 756
One eyed shark ( what a great name )

Thank you for your reply. I would be the first to say that I have probably not fully grasped this method and I do accept that it could work in any time frame just as trend etc will do. But essentially you benefit from a good trend period within the day. I probably gave the wrong impression and thought it had more benefit for longer term strategies as I saw it was something that could be applied without the need to remain in front of your computer as day trading requires. I felt it was evident that establishing this set up on a daily chart you would be aware of points 1, 2 & 3 so could anticipate a reasonable entry.

As to the example we operate slightly differently and in the first entry I would have taken it very close to the top of the failure of the bar where point 3 is generated. I know this has some downside but the data available at the time of this deal would be
1. The immediate up trend has been broken which may suggest a change in direction or a slower rate of growth
2. The forming of a lower top which illustrates pressure to move higher at this time and is also a move down off the underside of the extended bar trendline. ( Not to be confused with the true up trend line )

I accept at this point the up trend has not been broken properly but the immediate momentum is with a move down. I also accept and look for how much the first pull-back is before the original trend has another go. Point 2 to 3. If the making of point 2 appears to break previous resistance to the original trend ( up ) then in this case the sell has a greater probability of success when point 3 is seen. Day trading tends to be momentum based and I find it is best to get on a move early.

I accept the points you make about high probability using the TTE especially when using low time frames keeping you closer to the action. In the example your entry appears on the 1st failure below point to and leads to the hook being taken out. I suspect this is a safer method because it requires you to wait for point 2 to have been broken and re-tested rather than suffer the whipsaw by placing your entry just below point 2.

What I have done is study the different formations the price makes when completing a trend change, I know the breaking of point 2 and subsequent failure is the true break of the immediate trend but that entry in this case is behind the action when the earlier data seen near the top of point 3 is in this case my entry point with a tight stop just above point 3. However I would add that in this example I would be concerned that the 1st pull-back did not move lower and would want to be aware of the longer term trend. Nevertheless with a tight stop it either works or does not. In this case it would have and earlier than the TTE signal but as I have already said the TTE is probably safer in that it provides less failures. My own set up would also look to point 2 as an area of profit taking as a precaution but when the TTE is seen it is confirmation to let it run rather than join IMHO.

What I would add from ny brief understanding of this method if I now do not get a good retracement against the existing trend to form point 2 then I would wait for the TTE or immediate bar failure below point 2.

Personally what I find the most difficult aspect of trading is when to take profit. Using low time frames means you get out of the longer trends earlier but probably take more positions as you trade the trends of the time frame you are trading.

I suspect that I need to read the book rather than rely on the free web version. Does his new day trading book include hooks.

Regards

Kevin
 
Old Shark, would you please post your one days' trades with this method (a mediocre to bad day would be best), in ES YM or NQ?
 
Traderkay

Have posted todays trades, this chart is a 3 minute AB H5 ( Russell ) for today, and in the next post I will put up a 2 minute YM also for today.

The trades I have taken are in the black font , I have also annotated the charts in red font , though I did not take any of the red trades.

Hope this helps.

OES
 

Attachments

  • 3mar ab h5.JPG
    3mar ab h5.JPG
    111.3 KB · Views: 692
Maybe I am missing something here but on the charts you display shorts taken during a rising sequence which IMHO have less probability than trading in line with the trend of the moment.

I know you say the hooks do not delay your entry but from some of the above examples the hook is seen very much after support has come in after the first trend break. This is why I claimed for day trading purposes other methods can get you into the deal much earlier so therefore also providing an opportunity to get more or out earlier should you wish to.

I am not posting to offend but to illustrate where I am coming from. I have reproduced your last chart to show what I mean by displaying blue trendlines and comments in blue.

When you were considering the short there was previous data to suggest the up move had more probability because the trend at the time of the short had remained intact.

My approach is very basic but you can see the difference between the respective entry points from the 2 systems. The main difference is that I do not look to play all 1- 2- 3 formations but take note of them at important turning points.
 

Attachments

  • 3mar ymh5.JPG
    3mar ymh5.JPG
    109.7 KB · Views: 488
I have taken the liberty of amending the last chart to illustrate the area around the entry point I displayed on support for the up move above the break of the blue trendline.

I think the area I have circled in black has a 1-2-3 formation and the area that I read as a higher low after the downtrend was broken and an entry point into a new up move is also point 3. There appears to be an potential hook created by a 3 bar top with a slight retracement producing a tight range for consideration of a Traders Trick Entry. If this is correct then in these circumstances the Hook and TTE are seen much closer to the entry point I highlighted in the previous post.

I would welcome comments on both posts to help my comprehension of this system and its advantage over simple trend line analysis.

In respect of my earlier chart the 2nd trendline shown later in the trend is what I believe is called an extending trendline to show how a lower entry point to a rising trend can be taken when normally one looks for a higher low before rejoining an up trend unless using other tools for entry.
 

Attachments

  • 3mar ymh5.JPG
    3mar ymh5.JPG
    111.2 KB · Views: 498
kevin 546

Your reference to my losing trade yesterday is understandable, for clarity the trade entry was taken off a 5 min chart, I only posted the numbers onto the 3 min AB to save time and avoid posting an additional chart at the end of a tough day. I have now posted the 5 min chart .

It is very easy to see after the event that a 123, infact is a contiuation, however my trading style involves me taking low risk positions that will allow me ideally to make a small profit when I am wrong and a larger profit when I am right.

The 123 on the YM paid +5 on the failed pattern, the AB 5 min then started to print a 123 along with drastically reduced volume and a #3 bar that closed at its low, to me this was showing signs of weakness, we all read the market differently , but my trading rules said I had to be in the market short, I got hit for - 4 ticks, big deal. I finished the day with 4 winners and 1 loser and cash flow positive on what for me was a diificult day to trade.

In refence to the 123 low on the YM , for me the bars were far too narrow to consider either a RH or a 123 and with the recent congestion it was clearly a sit on hands time.The right trade for me would have been to take the first RH after a breakout of the congestion high or low.

We have to understand that a 123 says different things to us all, I am looking for a possible reversal, followers of Chartmans thread may be looking at it and see a bull flag forming and look for a continuation, we all have orders in the market looking for a break one way or the other.

To take these patterns purely in isolation can be dangerous, you need to look at the bigger picture starting with the range of the bars and the underlying volume.

These patterns consistantly provide low risk entries, how many trading styles pay you when you are wrong ? it is not just the patterns you are trading with but the psychology of the market.

We all have different priorities as traders, mine is to keep losses absolutely minimal, I will also take profits very early.

No offence taken at all , only posted the charts to help provide some clarity, am done for the day as this is like watching paint dry ( obviously the markets not T2W :cheesy: )
 

Attachments

  • ab 5 min.JPG
    ab 5 min.JPG
    26.2 KB · Views: 419
Thanks for the reply. Out of interest do you trade in halves taking early profit with one and allowing the remainder a little more flexibility to trend or do you take your profit in a single lot.

I know it is said trading in lots does not make the best use of your capital but then it can be difficult to make your decision on a single basis unless taking a fixed amount of profit. Taking it over 2 lots allows for a little flexibility in your decision making.

regards

Kevin
 
traderkay said:
Where did Roberto go?
The last email I had from him rather suggested that he eventually got fed up with getting insulted by idiots here (and by a couple of other lesser issues affecting the site as well, I think). Can't say I was surprised. It's what often happens: the people who actually know a little about something get driven away by people whose opinions are bigger and more numerous than their braincells. He may reply to PM's - I don't know. Can't blame him for wanting to spend his time making a living rather than arguing, though.
 
Top