You are using an out of date browser. It may not display this or other websites correctly.
You should upgrade or use an alternative browser.
You should upgrade or use an alternative browser.
frugi
1
- Messages
- 1,843
- Likes
- 133
Clarity of 1-2-3 definiton.
We seem to be speaking of two slightly different formations, although they are very similar in spirit:
The Sperandeo one (first thumbnail) -
1. trend line broken
2. lower high in an uptrend, or a higher low in a downtrend.
(also 2B. where the price makes a higher high then the top of the trend then immediately falls back closing below this high)
3. break below the previous low in an uptrend, or above the previous high in a downtrend
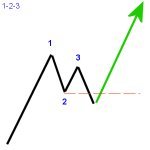
The "Roberto" one (second and third thumbnails) -
1. A top or bottom (confirmed by point 2 breaking a trendline, I think)
2. The first reaction low/high
3 The next reaction high/low in direction of previous trend (as long as it does not exceed point 1)
Is this correct?
(The second and third thumnails should work if you click on them)
We seem to be speaking of two slightly different formations, although they are very similar in spirit:
The Sperandeo one (first thumbnail) -
1. trend line broken
2. lower high in an uptrend, or a higher low in a downtrend.
(also 2B. where the price makes a higher high then the top of the trend then immediately falls back closing below this high)
3. break below the previous low in an uptrend, or above the previous high in a downtrend
The "Roberto" one (second and third thumbnails) -
1. A top or bottom (confirmed by point 2 breaking a trendline, I think)
2. The first reaction low/high
3 The next reaction high/low in direction of previous trend (as long as it does not exceed point 1)
Is this correct?
(The second and third thumnails should work if you click on them)
Attachments
FetteredChinos
Veteren member
- Messages
- 3,897
- Likes
- 40
the 2nd and 3rd ones really do reflect the "dark side" of trading, dont they?
😉
😉
frugi said:Clarity of 1-2-3 definiton.
We seem to be speaking of two slightly different formations, although they are very similar in spirit:....
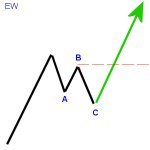
What I am worried about is that other labelings talk about a correction typically being a zig-zap pattern (ex. Elliot Wave, bull flag, ...) where there is first a retracement (A), then a test of the high without breaking it (B) and then a futther low (C - which is often equal to the price length of A).
I do find this formation a lot when looking at corrections.
If this is a typical occurance - and I think it is - wouldn't it then follown that the majority of a 1-2-3 break-out is, if not false, at least minor, on an unfinished retracement?
For example, if the first retracement (A) is 10 pts down, the test (B) then goes up about 6 pts, and then the final retracement (C) would go down by 10 pts to break the prior low (A) by 4 pts. (10-6), and first then the full retracement would be over... whereas treating it as a 1-2-3 would have gotten us in on the break of C.
Ok, I have just read back what I wrote - clear as mud, really - but I hope you can see what I am getting at.
Whereas the RH works a treat because it is already in a trending market, I can't seem to be able to fit the 1-2-3 formation until after the fact.
I would be interested to know what you people do to avoid this situation - or point out to me what I have missed if indeed this check is already in the 1-2-3 somewhere.
Please feel free to knock me if I have misunderstood something . I has happened before, you know... 🙄
They're more or less the same formation, I think ... although the labelling is clearly very different. Your first and third attachments are basically the same beast, but Trader Vic got the labelling wrong. It happens to the best of us! 🙂frugi said:We seem to be speaking of two slightly different formations
I think that's right. But as you say, the RH can only exist in a trend, whereas the 1-2-3-formation is more of a reversal pattern, so unless you're living "adventurously" you wouldn't be trading it until after identifying the 3-point. Unless I've compounded the confusion by misunderstanding you. 🙂Jyde said:Whereas the RH works a treat because it is already in a trending market, I can't seem to be able to fit the 1-2-3 formation until after the fact.
Roberto said:... Unless I've compounded the confusion by misunderstanding you. 🙂
I think you did, but I can also understand that you would! 😱
No, my point was that - in my scenario - the number 3 of the 1-2-3 would happen before the full correction was done. This was assuming that is was only a correction whereas the 1-2-3 would call it a reversal before time.
Hm, would it actually help if I posted an example, or would it just muddle the waters of this thread?
All the best...
After the convoluted start I inadvertently got us off to 15 pages ago, it's hard to see that anything can muddy the waters too much by comparison at this stage, so why not give it a try? 🙂Jyde said:would it actually help if I posted an example, or would it just muddle the waters of this thread?
frugi
1
- Messages
- 1,843
- Likes
- 133
Silly Trader Vic 🙂
Although they are pretty much the same beast, in the second definition does a trendline actually have to be broken before you mark point 1, or is point 1 simply the bar that precedes the first bar not to make a higher high?
What I mean is that you could mark points 1 and 2 without the trend being broken, which is why (I think) I prefer Vic's definition as it is perhaps more reliable. Trend broken >> lower high >> break of previous low. All very easy to tick off in real time. And the 2B is still a cracker even after all this time.
Anyway I'm splitting hairs, sorry.
Onto Jyde's chart...
Newtron Bomb
Guest Author
- Messages
- 1,602
- Likes
- 87
frugi said:Silly Trader Vic 🙂
Although they are pretty much the same beast, in the second definition does a trendline actually have to be broken before you mark point 1, or is point 1 simply the bar that precedes the first bar not to make a higher high?
What I mean is that you could mark points 1 and 2 without the trend being broken, which is why (I think) I prefer Vic's definition as it is perhaps more reliable. Trend broken >> lower high >> break of previous low. All very easy to tick off in real time. And the 2B is still a cracker even after all this time.
Anyway I'm splitting hairs, sorry.
Onto Jyde's chart...
I think it really depends on how close to the TL that the pattern develops. If the pattern is almost bang on a TL then you can count the pattern starting when the TL is broken and a lower high (for a short) is made.
However, if the 123 is a fair old distance from a TL then why wait. Ive seen (on forex) too many times a 123 form above a TL and turn. By the time the TL has broken you have missed the trade or you would be looking at TL support and a potential long trade. Either way you ve missed it. (this is what I call a regression to the mean type of trade)
Its all down to how the individual looks at a trade set up. One person may prefer a TL break (as I did for a long time) while others may want to see other conformers like a macd cross or stoch indication.
Horses for courses, I dont think it really matter too much.
Roberto said:After the convoluted start I inadvertently got us off to 15 pages ago, it's hard to see that anything can muddy the waters too much by comparison at this stage, so why not give it a try? 🙂
Don't be too hard on yourself. Many times, corrections can be more informative than being right from the strart. At least I'd like to believe that. 😆
Here is what I meant. As you can see, on the 1-2-3, a reversal would have been declared on the break-out.
Attachments

erierambler
Well-known member
- Messages
- 265
- Likes
- 8
Jyde said:Don't be too hard on yourself. Many times, corrections can be more informative than being right from the strart. At least I'd like to believe that. 😆
Here is what I meant. As you can see, on the 1-2-3, a reversal would have been declared on the break-out.
Jyde,
Pardon my jumping in here , I like 1-2-3 formations. The a-b-c correction in Elliot Wave you are referring to happens after the completion of a 5 wave sequence. (according to Robert Miner). Not necessary to worry too much about it.
erie
erierambler said:Jyde,
Pardon my jumping in here , I like 1-2-3 formations. The a-b-c correction in Elliot Wave you are referring to happens after the completion of a 5 wave sequence. (according to Robert Miner). Not necessary to worry too much about it.
erie
No, good to get feed-back.
I just hope Roberto forgive me for introducing EW in the thread. I only meant to use it to illustrate a typical pattern for a correction/retracment. 😱
As for the ABC at the end of the trend - correct and 'incorrect'. It does, of course, happen there, but the trend leading up to it will have a W:2 and W:4 correction in it as well, which will be a ABC (or more) too... as will W:1:trend... etc. down the microscope.
On an aside, I wouldn't mind if you PMed me to have a little 'miner' chat - if you feel like it, of course..
Roberto, by the way - did you mention your trading hours for the instruments you have chosen for this? I seem to recall that you did but cannot find it.... as usual, if you don't mind me asking, of course.
I just ask as I seem to spend a lot of time chart-watching since trying this out - and with my usual luck, the hooks only seem to develop when I go to get a cup of tea. 😕
All the best...
Interesting chart Dave JB, as there's also a trader vic one in there, and I don't know where price is now, but isn't the last low a higher low, after a recent downtrendline break? (sorry to be making new words here!)
So we have a 1-2-3 top AND a TraderVic 1-2-3 low.........or am I mistaken?
Cheers
Q
So we have a 1-2-3 top AND a TraderVic 1-2-3 low.........or am I mistaken?
Cheers
Q
Think I said facetiously that I only trade when CapitalSpreads is open. Honestly my trading hours are selected on the basis of fitting in with other things I happen to be doing, not anything as sensible or logical or reasonable as "good times that fit the instruments"; sorry.Jyde said:Roberto, by the way - did you mention your trading hours for the instruments you have chosen for this? I seem to recall that you did but cannot find it...
Yes; I know exactly what you mean. 🙁Jyde said:I just ask as I seem to spend a lot of time chart-watching since trying this out - and with my usual luck, the hooks only seem to develop when I go to get a cup of tea.
Roberto,
If you enter a 123 trade and the price seems to go nowhere, do you get out before it eventually hits your stop or just leave it there?
Another question, JR says that trader's trick entry is to be used for the first 3 bars after point 2. If you can't get in within 3 bars, you have to assume you cannot use TTE in this instance. Question is, do we then wait for an actual breakout above point 2, or do we forget about using 123 for the time being on this market we are following and wait for the next formation?
Thanks.
Just a quick reminder to all that the traders trick entry relies on being able to scale out of a position. In other words, if you're not able to take some profit as the entry is "tested", then your exposure remains absolute! I guess you may be able to exit on b/e, but maybe not if trading a volatile instrument on shorter timescales.
Q
Q
pratbh said:Roberto,
If you enter a 123 trade and the price seems to go nowhere, do you get out before it eventually hits your stop or just leave it there?
Another question, JR says that trader's trick entry is to be used for the first 3 bars after point 2. If you can't get in within 3 bars, you have to assume you cannot use TTE in this instance. Question is, do we then wait for an actual breakout above point 2, or do we forget about using 123 for the time being on this market we are following and wait for the next formation?
Thanks.
One more question Roberto before I forget: JR says pull your stops to breakeven as soon as practically possible. Obviously 'practically possible' would mean different things to different people. What sort of strategy do you follow here?
Thanks as always.