1-2-3-Formations and Ross Hooks

Frugi

Thank you for putting up the link it will be an interesting read. As to the 2nd time through it does help to understand the concept of the order situation, although I think it is quite commonly known that price will be pushed an pulled around these levels to lock in the business of these orders.

The one thing that I see from this set up is the fact that the entry is taken at a safe junction which is a good thing but at what seems a considerable distance from another method surrounding basic trends. If you are aware of these set-ups and that there is a likely outcome where you are waiting on the side of the previous trend and you know there is a chance of 2 moves down then why not sell / buy the existing trend when they turn. First you have a tight stop just above the top, 2nd you are expecting a bounce so you can close into the congestion should you wish to. Dependant upon how wide the swings are then you could risk buying the bounce, otherwise you wait to hit the sell again and maybe see this one through.

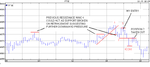
The reason I mention this is because in the example shown on JR's pdf it is a clear case of the price bars appearing to break the trendline of the bar tops but not take out the last main resistance to the up moves when in the downtrend. In your example that is not quite the case and it would be interesting to see this same dat on a 10 or 15 min chart to establish where the last main resistance was to pullbacks against the down trend. At a guess I would suggest they may show that the rise seen in the breakthrough of congestion did not take out the main resistance and so the previous trend continues not unexpectedly.

This is something I have studied when applying trends and normally tends to be a false move against the previous trend although I have not considered it for congestion before but as a minor correction but essentially it seem the same ingredients are involved in terms of how the trend remains intact overall. If you have access to the chart in a 10 or 15 min time frame I would be interested to see the comparison if you have time.
 
One Eyed Shark

If you get time do you think you could post a 15 min chart of this instrument over the same period for comparison I do not currently have access to it.

I look forward to the book if nothing else I will find it an interesting read as I have with most that I have indulged so far they might not have want suits me but they are always of interest and there is always some snip-it that I can find use of or adapt to my own liking.

I hope you do not mind I have taken your chart and just added a couple of lines to illustrate when I would have changed my emphasis from short or long. There are a couple of examples of extended trendlines where what was support can become resistance lines in the future and vice-versa. Why buck the trend.

How do you take your profit, in lots, a set target or concluding signal. I am currently trialing a fixed target intraday of course but I am trying it with the 15 min on the FTSE hence the 15 min because it is a slow one.
 

Attachments

  • ym38305.JPG
    ym38305.JPG
    157.4 KB · Views: 396
OES, just out of curiosity and completely off topic...
Why are some candles shown without body and others filled?

All the best...
 
Jyde

I think you will find that the candles are filled when the price moves below the open position of the candle and is hollow when it rises from the opening position.
 
One Eyed Shark

Thank you for taking the trouble to post the chart it is much appreciated. I hope you do not mind but I offer a different perspective. Of course the entry positions are dependant on what method of profit taking one applies so some deals may appear to early to close while others who go for small points may accept the other entry positions within the trend.

I know this is posted after the fact but that is not the point, I am just displaying what I look for on the instrument I trade although I prefer bar because I feel they work better with trendlines. Plus I use Bollinger Bands for the purpose of profit taking when staying with a trend or taking fixed profits for price position from the patterns they display.

I do not like to trade in the afternoon of evening so I must stick with the FTSE I have stuck all my efforts into one instrument in order to try and learn some of the plays it repeats and get a feel for it. But it looks to me that the YM has some very good opportunities to day trade especially with a decent spread. I have had to adapt my strategy now that the daily range on the FTSE has reduced this past year or so but there seem to be some decent swings in this today.

Anyway I post for comparison, I know it is not JR so I apologise if anyone is upset by this.

Regards

Kevin
 

Attachments

  • 15min.JPG
    15min.JPG
    129.7 KB · Views: 463
Jyde said:
OES, just out of curiosity and completely off topic...
Why are some candles shown without body and others filled?

All the best...

With TradeGuider the filled bars are down bars and the hollow bars are up bars. The color of the candles is what TG thinks of as the medium trend. Just ignore the color of the bars...
 
Skog said:
With TradeGuider the filled bars are down bars and the hollow bars are up bars. The color of the candles is what TG thinks of as the medium trend. Just ignore the color of the bars...

Thank you, it was the colour that confused me (you know, I saw green as up and red as down).
 
Somehow I just dont see this being better than a coin toss on an intraday chart of S&P although thats what Ross says he traded.....
 
It seems to me that the Hook concept benefits a trending market like some other strategies.
For example in order for a deal to be seen you need a 1-2 -3 formation then you need this pattern to be broken to create a trend. You then require the trend to stall creating the Hook and then support for the trend to continue to generate the TTE or Hook entry signal.

I think One Eyed Shark added that the Hook should not be seen to close to point 2 so it is best for the signal to be stretched to clear out false swings.

From price you get the same circumstances on the chart if you apply a pattern of Bollinger Bands in a strong trend where the bands open and loop after the initial trend break. Often you will see the price retrace to a mid position of the looping bands and then continue the trend which is an opportunity to join in and this would be like a TTE entry.

SMA's are also used like this where they are stretched up or down following the price, after a trend break as the move pulls away the gap increases leaving the sma behind. As the price retraces it produces another opportunity to join the trend as the price returns to what is know as a value entry. It works on all time frames.

I am also aware of a system using CCI in conjunction with the 33 ema on a 1 min chart the trader would only use bounces off the 0 line with the price under a sharply falling ema or a strong upturned ema.

Intraday situations could also be continuation patterns such as flags or repeat price sequences of similar range.

These instruments would look like this when you are contemplating the Hook. It maybe safer but it requires a good strong trend to produce the signal whichever time frame you trade and essentially all that is being done is making use of an extreme period according to the time frame in the context of how the price has performed beforehand, because these patterns can be generated on all time frames and do not need large price moves but large moves in conjunction with what has occurred on the chart before. IMHO

In terms of price activity it is nothing new and can still be delayed IMHO, but as with all trading you have a system and if it requires specific circumstances then that is what you wait for and make the best of it when it is presented to you. I still feel it is better suited to EOD. I am not saying it does not work I just think there are better options available. However I would add for day trading it is an excellent signal for giving confidence to let a deal run on or enter again for another piece of the action.

Regards

Kevin
 

Attachments

  • z.png
    z.png
    6.1 KB · Views: 600
More specific.. OK. Ross said that he traded his techniques on 5min S&P for a long time. Can someone post a chart of today's 5min ES contract with Ross style trades? I just dont see them being profitable.
 
traderkay said:
More specific.. OK. Ross said that he traded his techniques on 5min S&P for a long time. Can someone post a chart of today's 5min ES contract with Ross style trades? I just dont see them being profitable.

I have had a bash with 123's and a few TT type entries. Easy to do after the market is closed but not so easy when it is open
:)
 

Attachments

  • ES.gif
    ES.gif
    19.3 KB · Views: 501
Bigbusiness

Nice clear chart. As to difficulty if you mean trading this way I would disagree. While I do not support trading by the Hook or TTE method for day trading unless you wish to apply it to a 1 minute or tick ( second ) chart for more popular time frames I find it lags far behind other methods. Personally I do not like to day trade from a low time frame, I do not mind using the 1 min when the 5 or 15 are presenting opportunities but I have find for me there are to many false signals. I prefer to play the trend and get something reasonable from the 5 min perspective.

When day trading it is well known that unless you are position trading something like the 10 - 60 minute charts for overnight considerations to several days in a good trend then most other traders are in for only the present session. This means that they are playing for what is essentially small price moves by comparison. Obviously this also depends on the instrument and I would think that to get good day trading opportunities frequently you need to trade the FX, US indicies like the DOW or US volatile stocks. But anything else in Europe save for maybe the DAX will not get much from it.

The deal I posted yesterday shows that on the FTSE which I accept is like watching paint dry illustrates you get quite a small part of the overall move. As daytraders not every day is a good trending day but the chart will offer price moves in relationship to the range of that day and so some moves may appear more severe even though the actual price distance covered may not be vast. Trading is about having a plan that works more times than it fails and clearly this would fall into that category, because you will take profit from it but in day trading it just maybe a smaller return.

Day trading requires a method that can accommodate the trader every day with the attitude being that deals are closed before the end of each session as the new day really is another day. Therefore an active trader will require a method that can allow for a reasonable number of opportunities to trade. A method that allows you to trade every day even in tight ranges has more to offer than just one that trades when you get extreme price activity.

Maybe I am missing the point of the Hook method but yesterday in this particular deal the Hook gave around 10 points on the FTSE before the 4.30pm close which can be a lottery. However the trend had been broken well before and a nice lower pivot afterwards with over 20 points in all. You can either enter earlier and take something from both methods or trade the trend and give the deal the chance to break through. Getting in on the Hook or TTE in this example returns a profit but a small % of the complete move.

Do not misunderstand me I am not talking here about trying to get it all but in getting onto the momentum of the move earlier and benefiting from more of the move according to your risk and profit expectation. All profit is a good profit I just feel for the purpose of day trading the Hook method produces less profit and less opportunities to trade. When day trading you need price movement in order to give you the room to take profit and I feel the Hook is giving away a lot of that room which for me is an unnecessary risk control approach. There are other ways to get around the hidden market manipulations which essentially the Hook is set up to achieve. IMHO.

What I like about this method is that it confirms those entries taken earlier allowing for positions to be held longer and that more may come from the move at a time when you might have considered it was time to close with the price move already seen around the TTE or Hook as already extended.
 
kevin546 said:
Bigbusiness


The deal I posted yesterday shows that on the FTSE which I accept is like watching paint dry illustrates you get quite a small part of the overall move. As daytraders not every day is a good trending day but the chart will offer price moves in relationship to the range of that day and so some moves may appear more severe even though the actual price distance covered may not be vast. Trading is about having a plan that works more times than it fails and clearly this would fall into that category, because you will take profit from it but in day trading it just maybe a smaller return.

.

Maybe I am missing the point of the Hook method but yesterday in this particular deal the Hook gave around 10 points on the FTSE before the 4.30pm close which can be a lottery. However the trend had been broken well before and a nice lower pivot afterwards with over 20 points in all. You can either enter earlier and take something from both methods or trade the trend and give the deal the chance to break through. Getting in on the Hook or TTE in this example returns a profit but a small % of the complete move.

.

Kevin

Please excuse me for being a bit late on the scene and maybe not fully up to speed with your discussion, but your ftse chart was a bit confusing.

So as 123 and hook trades go I have annotated in green where I think the entries would have occured and circled the entry bars. You would have had around 20 points (potentially) from the first entry and a further 12 maybe from the addition. Spreads notwithstanding of course!!

What triggered your entry and why was it taken out? Just interested - not meant to sound like an interrogation :)

good trading

jon
 

Attachments

  • ross.gif
    ross.gif
    9.1 KB · Views: 525
Jon

No problem. The discussion was that I was illustrating how the Hook is a delayed entry position and compared it to my own. The entry positions you display according to 1-2-3 are correct although I enter as shown that is how I follow my signals. I am not trading using the Hook unless as an opportunity to enter a 2nd time or hold onto an existing position as I did yesterday. The Hook concept as I understand it is not to enter on the 1 -2 -3 as I do given the correct circumstances as displayed in the chart but to wait for a Hook to be created and then enter using the Traders Trick Method.

Your entry line on the 1st position is correct but I do not wait for the bottom of this bar to be taken out so my red line indicate that I enter 1 point beneath this mark. That is because I will be reading the price / tape whatever you want to call it and with the trend already cut a lower top being formed I am happy for the previous bar top to show a low closing position. Yes this is early from this time frame but at the point this chart displays that action a lower time frame such as the minute will already have formed and confirmed a lower top. Hence the decision to enter then.

The issue being introduced by me was that as good as the Hook method is I felt it gave away to much for day trading compared to alternative methods and was better suited to longer time frames. This chart illustrated this by the % of profit that could be obtained from the move compared to the 1st entry which would not be taken if following the Hook method.

Therefore my chart was to illustrate the position of the Hook and not the correct entry for position 1 - 2 - 3 but that of my own.

Hope that clears things up.
 
I should have said when looking at my entry position I wait for the previous bar top to be passed on the way down ideally with the entry bar opeing higher and moving straight down. However I will accept an entry if this bar passes below the top of the previous one appearing to create a lower top if it is towards the end of the present bar period because from a lower time frame more bars will have formed after the top has been seen.
 
Kevin

Crystal clear, thanks.

Like you I think RH better suited to the longer time frame but it's horses for courses and there are many who like it for day trading.

good trading

jon
 
No problem and I do accept that it can be used for any time frame. I think that you have to establish what you feel most comfortable with and what appears to work best for the instrument you trade. The thinking behind this method appears sound and may I suggest even thought provoking.

How often have you seen a set up only for it to disappear, was this caused by manipulation with someone or group who have the intent and the means to control the market flow. Any method that is developed to identify market manipulation and trade with the intent that others are able to put in place has considerable benefit and probably would fall into line with a contrarian plan.

If you trade numerous instruments then it has to be from a basic set-up that works regardless. If you specialise then again it maybe from a selective group of signals or simple methods for trading in different market conditions whatever works. I am always surprised and interested in how many different approaches people have to trading the market and the impact they have when you realise others might be entering when you would be getting out. But as they say it all helps for an active market.
 
Top