Unfortunately this is what happens on any good thread not just on this site. Why people with different opinions cannot just pose the question and discuss each perspective and the merits or not in a friendly unabrasive manner is beyond me. I may not agree with everything that is posted on a good thread, probably because I have not fully comprehended what is said but I am open minded and prepared to consider something of merit that is worth further investigation. Unfortunately all that happens is the thread disintegrates with rubbish by those intent on no other action than to ridicule and upset. The end result is the thread comes to an abrupt halt and what may have been a useful insight into an aspect of trading is lost. When will such idiots be stopped.
You are using an out of date browser. It may not display this or other websites correctly.
You should upgrade or use an alternative browser.
You should upgrade or use an alternative browser.
Kevin
I agree with your post 203 and would mention I have been following this thread from the beginning .
It started just at the right time because I have been studying the 123 set up recently and I have vastly improved my understanding of this particular set up.I would like to say that Roberto started an excellent topic and would like this to continue.I think we have some very experienced traders posting on this thread and I would not like to name them, because I may miss out some one who is equally as good .
I do hope the thread continues and if possible I would like to see more set ups using EOD charts if thats OK.
regards
Fluke
Although I have only recently discovered this thread and not really had time to go through it properly the RH concept which I have read on the web version has intrigued me because some of it is so very close to what I do. I like to think I am open minded so that is why I am now starting to research it but as yet I remain unconvinced that for the purpose of day trading, certainly anything higher than the 5 min time frame the Hook method gets you in a deal as early as some basic trend or 1-2-3 formations at the end of a trend. But I am willing to be convinced.
I also take on board that this method takes account of what you cannot see and that the entry is based on trading in line with the intent of the real market.
If you get the weekly chart scan newsletter that Joe Ross provides there have been some eod examples
see
http://tradingeducators.com/newsletters/chartscan/vol_42/index.htm
for this weeks article on the Australian market there are several examples in the trend of TTE's and a deal taken is identified.
Kevin
One Eyed Shark
Well-known member
- Messages
- 257
- Likes
- 13
ccasadei
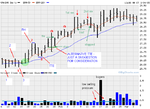
Entires look good to me , not sure if I would take the 123 as such or label the #2 a RH after a breakout of congestion, one reason being the range of the bars that come after #1 possibly suggesting some pent up frustration after a period of consolidation ? there is also some decent volume behind them
Can never get my head round daily charts, so many gaps that always seem to get filled , would shake me out of my positions far too early, to me entries are fairly consistant for any group of people trading the same strategy but exits are so personal we all have different risk tolerances.
Only comment would be where you have marked "buyers", if such a heavy volume of buyers had come in at this stage it is very unlikely that the next bar would be a down bar, I would read this as larger players exiting positions from the move up, this would usually be followed followed by a period of congestion with the higher volume on the down bars, again larger players exiting before we get a break to the downside, would be interested to see how the stock plays out.
Kevin546
You will be converted yet 🙂 ......... would be interested to see how 123/RH compare to your strategy, we are all looking to learn something
ccasadei
Please be aware that I do not at present trade the Hook but do apply 1-2-3 formations to intraday trend changes. Therefore my comments in relation to the Hook concept could be incorrect.
First I must say I like your charts, is that how the real time version of Big charts appear.
Another thing any profit is a good profit because that is the objective.
I have reproduced your chart with a couple of amendments, not to suggest what you did was wrong but an alternative view open for discussion. I must point out that my comments come from the day trading background so please bear that in mind if I have made an almighty blunder in dealing with an EOD method.
The early bars in the chart you displayed suggest that they may have been moving in a down trend, if this was the case then I have offered up an earlier 1-2-3 formation. In a tight range I grant you but I see a 1-2-3 formation nonetheless. If that is the case then I see your 1 as a 3. The price then moves higher. For what it is worth from a day trading set up I would enter on a different strategy using the 1 position bar as a signal to enter as the price crosses the base of the previous bar, but thats another matter entirely.
Now I accept that the 2 bar top formed at your point 2 probably does not form a correct Hook but I see this as a retracement against the trend and a turning point which is how I see a Hook. The retracement is confirmed with the next 2 bars following a down pattern. Interestingly a 3 bar move which is very popular in pullbacks before the trend is seen to continue as is the case in this example. Anyway as a result of this I see your point 3 as the beginning of a TTE.
My reasoning, which is probably wrong for the Hook concept, we have already seen the down movement prior to your position 1 being taken out. The bar after position 1 fell back a little from the top of the previous bar but then rallied thereafter so there has already been a secondary support for an up move. When support comes in at your position 3 or my TTE it is again more support for the up trend, therefore I would enter here using a bar base entry.
I realise entering at the base is not seen by some as confirmation of a move but this concept is about taking something should the test area fail. The earlier you get in the more chance you have of achieving this IMHO. You are also entering with a trend rather than against it so providing you have some safety with a stop and that the signals you employ have already shown a good probability of profit then so be it. That describes how I see the earlier 1-2-3 and TTE.
However looking at your 1-2-3 and the TTE I can see that with an EOD system the entry point is easier to contemplate using the breaking of the top bar which comes in before your Hook so the theory you have applied would be spot on. I have only shown an alternative entry position for the TTE in respect of entering the move earlier. Essentially this deal is about entering an existing trend because the price has shown by your Hook position at least 2 if not 3 higher tops. Within this trend the RH bar has formed another lower high confirmed by the bar that follows. Therefore in an attempt to get an entry prior to the Hook I would use the previous bar base which is above the RH low as a possible entry point.
Obviously an EOD system requires price entry positioning so unless you were able to monitor the market the next day and apply a shorter time frame to gain an earlier entry then my own entry suggestion may have been missed unless you allow a margin of error by placing the order entry price a little above the bar marker seen on the chart.
I hope my observations help rather than hinder and if nothing else will bring out a seasoned Hook trader to identify the correct method as I have shown my own interpretation with a mix from my day trading method.
Regards
Kevin
Attachments
Kevin546
You will be converted yet 🙂 ......... would be interested to see how 123/RH compare to your strategy, we are all looking to learn something
One Eyed Shark
I will try and do your question some justice
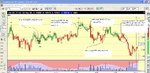
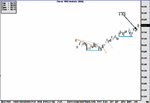
I hope Joe Ross will not mind my using his chart from this weeks scan as we are discussing Hooks and comparing ideas for discussion which promotes his work after all.
The chart in question is a daily one but as I day trade lets view it as an intraday chart. Remember I trade from price alone so I do not have considerations as to volume and would have to accept comments made regarding volume as correct as my knowledge is limited at best.
Ok there is a TTE shown which was the entry position provided by the earlier Hook seen 3 bars before and is a break out from what could be considered a congested area.
This chart is clearly in an up trend and although it gave the appearance of a failing with a trendline break followed by a bounce off the underside of this trend line, this for an intraday position would be a very quick deal because the trend remains intact. In fact and although I do not and cannot show this as fact I often feel these situations are where those who can control the market intent create this false picture in order to encourage shorts only to allow them to be taken out when they push the price on when they enter again buying in lower.
Anyway I mention this just to illustrate that the trend has already been tested and after 2 main attempts has pushed on further as illustrated by my blue lines. There are of course several entry positions for me on this chart but I will discuss just the TTE area to keep things on the issue at hand.
The blue line below the Hook displays areas of support for the trend and it is the trend that remains my main concern with the strategy I employ. Congestion forms within trends and I do not see this as an area to be avoided just to be aware of the limitations of the deal should resistance to the trend win out. However entering before the resistance means that should the price break out of the congestion and the trend continue you have a good position.
Therefore I see and entry before the Hook at the base line. I realise this has more risk attached to it because it has been taken during congestion when the trend appears to have stuttered and maybe tested. But once again it is an opportunity to re-join a trend and it is better to be trading with the trend than against it. However I would argue that the best time to enter a trend using my strategy is at the first opportunity after a trendline has been broken or a signal from an extended trendline. So from this chart an entry closer to the left hand side edge would be more appropriate.
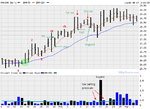
In order to try and show what I mean if you look at the 2nd chart I have removed a lot of the chart to try and display a down movement, imagine that what came before was a down trend.
The light brown line displays the extended trend line approach. This is not an ideal example because of the base support as that is an area where I would enter a buy. In order to try and explain this method disregard the base support and view the bars around the 1/17 as the 1st time the price ventured this low. You now see that the down trend line was broken to the upside, this alerts me to the possibility that the down trend is being challenged and may be tested again. The price is seen to fall back below this line but then bounces back up, I would enter a buy as close to the base of these bars indicated by the up brown line. If the extended trendline was not seen then the simple grey trendline comes into play and this is like your Hook concept because this method makes use of a 1-2-3 formation. The price breaks up over this line and passes the earlier point on the trendline. The price retraces and produces support for the up trend indicated by the up grey line. Given these circumstances I would enter as close to the base on the next bar, in other words when I am satisfied the bars are in an up moving cycle in line with the existing trend according to the time frame that I am trading.
I hope this explains where I am at. Until a few weeks ago I had never seen or heard of the Hook my method was developed around Trends, support and resistance as identified by the extended trendline and what I observed by watching real time price development and acceptance. I know that my entry point is against the true concept of a trend change signal because you should wait for point 2 to be taken out.
Regards
Kevin
You will be converted yet 🙂 ......... would be interested to see how 123/RH compare to your strategy, we are all looking to learn something
One Eyed Shark
I will try and do your question some justice
I hope Joe Ross will not mind my using his chart from this weeks scan as we are discussing Hooks and comparing ideas for discussion which promotes his work after all.
The chart in question is a daily one but as I day trade lets view it as an intraday chart. Remember I trade from price alone so I do not have considerations as to volume and would have to accept comments made regarding volume as correct as my knowledge is limited at best.
Ok there is a TTE shown which was the entry position provided by the earlier Hook seen 3 bars before and is a break out from what could be considered a congested area.
This chart is clearly in an up trend and although it gave the appearance of a failing with a trendline break followed by a bounce off the underside of this trend line, this for an intraday position would be a very quick deal because the trend remains intact. In fact and although I do not and cannot show this as fact I often feel these situations are where those who can control the market intent create this false picture in order to encourage shorts only to allow them to be taken out when they push the price on when they enter again buying in lower.
Anyway I mention this just to illustrate that the trend has already been tested and after 2 main attempts has pushed on further as illustrated by my blue lines. There are of course several entry positions for me on this chart but I will discuss just the TTE area to keep things on the issue at hand.
The blue line below the Hook displays areas of support for the trend and it is the trend that remains my main concern with the strategy I employ. Congestion forms within trends and I do not see this as an area to be avoided just to be aware of the limitations of the deal should resistance to the trend win out. However entering before the resistance means that should the price break out of the congestion and the trend continue you have a good position.
Therefore I see and entry before the Hook at the base line. I realise this has more risk attached to it because it has been taken during congestion when the trend appears to have stuttered and maybe tested. But once again it is an opportunity to re-join a trend and it is better to be trading with the trend than against it. However I would argue that the best time to enter a trend using my strategy is at the first opportunity after a trendline has been broken or a signal from an extended trendline. So from this chart an entry closer to the left hand side edge would be more appropriate.
In order to try and show what I mean if you look at the 2nd chart I have removed a lot of the chart to try and display a down movement, imagine that what came before was a down trend.
The light brown line displays the extended trend line approach. This is not an ideal example because of the base support as that is an area where I would enter a buy. In order to try and explain this method disregard the base support and view the bars around the 1/17 as the 1st time the price ventured this low. You now see that the down trend line was broken to the upside, this alerts me to the possibility that the down trend is being challenged and may be tested again. The price is seen to fall back below this line but then bounces back up, I would enter a buy as close to the base of these bars indicated by the up brown line. If the extended trendline was not seen then the simple grey trendline comes into play and this is like your Hook concept because this method makes use of a 1-2-3 formation. The price breaks up over this line and passes the earlier point on the trendline. The price retraces and produces support for the up trend indicated by the up grey line. Given these circumstances I would enter as close to the base on the next bar, in other words when I am satisfied the bars are in an up moving cycle in line with the existing trend according to the time frame that I am trading.
I hope this explains where I am at. Until a few weeks ago I had never seen or heard of the Hook my method was developed around Trends, support and resistance as identified by the extended trendline and what I observed by watching real time price development and acceptance. I know that my entry point is against the true concept of a trend change signal because you should wait for point 2 to be taken out.
Regards
Kevin
Attachments
It appears to me from some of the comments that there is more consideration with the Hook method than just price action alone. References to narrow range bars and volume have been raised during posts to nullify a prospective 1-2-3 or Hook seen from the price action.
I have to admit that my knowledge of the Hook is limited to what I have read in the Law of the charts and TTE article on the website together with the weekly newsletter.
It is evident that this method does work and achieves the goal that all traders aspire to and that is to make a profit. There are many methods of trading but not all methods suit everyone, I know I have tried a few good ones that did not work for me but were very good for others. Whatever method or time frame it just has to work for you.
As to volume I become a little uneasy with my ability to read this affectively. I also have some negative thoughts in respect of how this information becomes public knowledge. I can recall a time when I used to trade stocks and would watch the orders going through trying to establish the battle between the buyers and the sellers and to identify the large money players. But often orders would not be what they appeared, buys would become sells and vice versa when you looked a little more deeply. Delayed orders would appear, how do they mess up volume on intraday charts. As with anything to do with trading it does not work all of the time. Probably viewing volume on the daily time frame provides a better window especially if you view it as a total rather than what are buys and what are sells.
Information is withheld or misleading when it comes to intraday volume, on level 2 screens impending orders are not shown only what the market makers are prepared to show so you never see the full picture, but I accept there are those who can master all of this.
However I feel more comfortable working alone with price and accept there will be manipulation even with price. In fact it would be prudent that a trading strategy be developed to take account of those who have the wealth to make markets move to there intent which I believe is where the development of the Hook method comes from. It is not the best method but a successful method and attempts to deal with some areas of manipulation by standing aside when new trends develop. Instead of being lulled into a new move that to the uninitiated appears obvious the Hook traders say it is not right to get in because we do not know if this rise or fall is true. Instead they wait for appropriate levels to pass and for the market intent to become evident. Nothing wrong in that at all IMHO.
I see what I believe is price manipulation when in a down trend you see the price spurt up early from the off and possibly take out the intraday trend line only for the price to turn and continue the existing trend of the previous day. What has happened to do this? I maybe wrong but at least I think it is those who have the means and the intent to buy pushing the price a little higher, others see this and believe the move has merit and join on and others follow suit, maybe the instigators have to give it another push but ultimately the wider market causes the price to move up. The instigators now have a small profit and a price where they can now show the true intent and hit the market with a flood of large shorts knocking the price down. Seasoned traders see it for what it is and join the 'smart money' and the drive down gets further impetus from other outsiders and the downtrend continues until the instigators have the means to close. One example of manipulation and possibly accumulation at the cost of many unprepared would be traders.
I do not need volume to show me this but the ability to react to changing market conditions and play the % game. This is what I feel the Hook method is about just that like moving averages it can lag behind more conventional trend methods. I am not implying that is wrong or detrimental just an observation.
Has anyone here read the new day trading book by Joe Ross and if I wish to really understand the Hook method wil it be covered on this book sufficiently or will I need to by both if I wish to study day trading the Hook way.
Regards
Kevin
The 1.2.3 method has been around since 19.… But traders start giving them names. A trader on here had a great thread how he trades pivots 1.2.3 under the name cj12.he give exact entry prices and targets. But he pulled the plug on it for some reason.
As for the hook. all it is really a fancy word for buying strenth.in an up trend or down trend. after confirmations of a 1.2.3 of a breakout of a congestion area
sun
As for the hook. all it is really a fancy word for buying strenth.in an up trend or down trend. after confirmations of a 1.2.3 of a breakout of a congestion area
sun
Thanks for your input
all, thank you very much for your input. My ultimate goal is to combine the well defined methods taught by Joe Ross plus incorporate price/volume analysis.
I like to trade EOD and 60 minutes (less stressfull)...
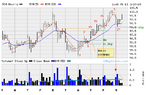
Attached another trade on OIH (60 mins this time).
all, thank you very much for your input. My ultimate goal is to combine the well defined methods taught by Joe Ross plus incorporate price/volume analysis.
I like to trade EOD and 60 minutes (less stressfull)...
Attached another trade on OIH (60 mins this time).
Attachments
One Eyed Shark
Well-known member
- Messages
- 257
- Likes
- 13
Kevin
Thanks for the post.
I have a better understanding of your trading style and I know it is an ambiguos statement but I think your style of trading fits in very closely with that of anyone who is following JR entry techniques.
123 and RH are by no means all that I have picked up from JR, it is only that 123/RH is available as free stuff that we appear to talk about it more than his other styles and entry techniques.
If you are thinking of buying "Daytrading" purely for the RH I think you will be disappointed there is not much more than is available for free, however alot of the other content is superb and very relevant to this style of trading.
Still disagree on the RH , yes it is later than other entries, yes it will yield less ticks , but it is consistant.
Bit like Arsenal a few years back 1 -0 but consistant 😆
One eyed shark
I know JR is a prolific writer and up till now I have assumed his main work was the Ross Hook. As a day trader I am interested in someone who I can relate to and from what I have seen of his Hook technique his work seems to fit the bill. I will be purchasing the day trading book however is his original work on Hooks still current and does it offer anything more than what is seen from the web version. I am currently researching the prospect of including longer trading in addition to the day trading for an all round perspective.
Regards
Kevin
ccasadei
Chart looks ok to me although I think the true TTE is meant to be after point 2 but before the Hook. It looks like one of my own deals taken between point 1 and 2.
But better get OEShark to glance over it to be on the safe side.
Regards
Kevin
Chart looks ok to me although I think the true TTE is meant to be after point 2 but before the Hook. It looks like one of my own deals taken between point 1 and 2.
But better get OEShark to glance over it to be on the safe side.
Regards
Kevin
One Eyed Shark
Well-known member
- Messages
- 257
- Likes
- 13
The RH in "Daytrading" is the same as what is freely available on the web.
Although 123/RH form the basis of the book there is signicant additional info and relevant techniques that have made me more profitable.
Although 123/RH form the basis of the book there is signicant additional info and relevant techniques that have made me more profitable.
One Eyed Shark
I assume your last post refers to JR's daytrading book, I thought this had only just been released.
What benefits would his original Hook book offer for non day trading and is this his main work or are his other books better suited to different time frames. As I stated in my last post I am looking to trade from the daily chart, maybe swing trading.
One Eyed Shark
Well-known member
- Messages
- 257
- Likes
- 13
Kevin
Yes " Daytrading" bought it 5/6 weeks ago.
previously have only worked from the free stuff, I have not bought any other JR book but thought since I was using his entry strategy so much I wanted to make sure I was not missing any bits of info.
Yes " Daytrading" bought it 5/6 weeks ago.
previously have only worked from the free stuff, I have not bought any other JR book but thought since I was using his entry strategy so much I wanted to make sure I was not missing any bits of info.
frugi
1
- Messages
- 1,843
- Likes
- 133
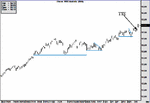
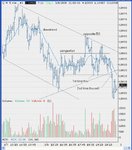
Not a 1-2-3 I'm afraid but a fairly good example of Joe Ross's "Second Time Through" I think, although the tiny first time(s) through is an arguable prod. I say (s) on account of the double bottom. What I would call the actual Second Time Through is more convincing because the bar closes below the congestion, breaking an innocent triangle in the process.
I sometimes use this pattern in a more basic manner to Joe Ross, i.e. if a congestion BO fails one way then the opposite BO is often a better entry than if there had been no previous failure. The chart mainly illustrates this personal interpretation.
http://www.trading-naked.com/Articles_and_Reprints.htm
Chapter 15 towards the bottom for explanation.
Attachments
One Eyed Shark
Well-known member
- Messages
- 257
- Likes
- 13
Kevin , I daytrade, I get a nose bleed if I hold a trade longer than 10 mins.
Since it has been an awful day to trade I have added possible entry points to a YM 3 min to show a fairer reflection
I only trade YM off 2 and 5 min, but since Frugi has done such a good job on the 5 min chart and I cannot fit all the 2 min bars on the screen I am stuck with the 3 min chart.
Apart from the obvious 123 and RH I have also included bar count trades that I would take, as I dont want to breach any copyright of JR and I have not seen bar count on the web for free, I have only marked the entries and leave you to draw conclusions regarding the strategy.