Traders go to great lengths optimising market strategies and trading systems to obtain good profitability. Unfortunately, those profits often deteriorate substantially after factoring in order fees. This article examines the effect of various broker commissions on portfolio performance and determines the optimal investment size needed depending on broker fees. The choice of broker greatly determines if a trader survives successfully in this business or quickly gives up in frustration.
Brokers use various methods to determine their pricing structures. They are often based on either block pricing (i.e. number of stocks per trade, investment amount, trading activity) or fixed pricing, better known as flat rates (fees independent of number of stocks traded or investment amount). That's why investors should determine trading magnitude and frequency before making a short list of brokers. Of course, commissions are only one aspect to be weighed when considering a broker, but as will see it is a very important one.
The author publicly trades a small model portfolio (ca. $8000.00) on his web page using a well-known discount broker and a defined trading system. When analysing the results, it became apparent that order commissions substantially reduced profits.
Performance during a five-month period from the beginning of May 2004 through the end of September 2004 amounted to a respectable 23.44%. The actual profit after subtracting commission fees was 15.90%, a reduction of more than 32%. Even the most robust of strategies can hardly make up for this "loss". It became apparent that a more thorough analysis of order costs was needed.
Peripheral Factors
The above mentioned model portfolio contains only US stocks traded directly in New York, so the broker's current commissions for the USA were used in the calculations. Additional costs (such as exchange fees) were not considered.
Eight stock baskets containing ten stocks each were traded equally resulting in 80 trades. The original historical data of the model portfolio can be viewed under www.value-trading.de/trades.html.
Looking at the results on the web page, readers will note a couple interesting differences. There are two reasons behind this:
For that reason it was necessary to determine the basic performance of the
trading system alone without consideration of order fees or money
management rules.
Performance Simulation
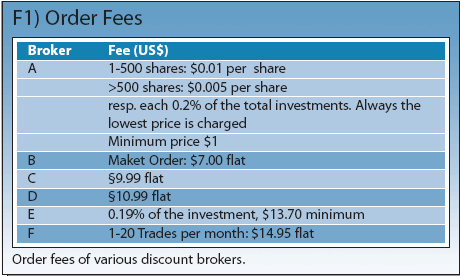
A simulation was conducted on the basis of basic system performance using an excel spreadsheet. For each broker a basket containing ten stocks was traded equally and the commissions for each transaction calculated. This was repeated using various levels of investment capital. The stocks and their buy and sell prices can be reviewed in the sample portfolio. The results are listed in figure 1.
Note that with varying portfolio performance the actual numbers diverge, that is to say a parallel displacement of the curves in figure 4 takes place either up or down, but the fundamental effect of order fees remains the same.
Commissions
The commissions used for each broker in figure 1 (understandably brokers are not named here) are taken directly from their websites. In some cases, commissions charged are dependant on the number of trades per time period (broker A and F). For these an average number of portfolio trades was used as a basis.
Results
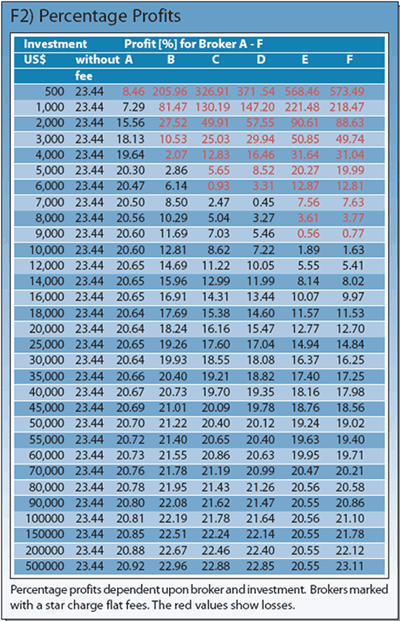
The amount of investment capital listed in the first column of figure 2 applies to a single basket (10 stocks). The second column shows the percent of profit without commission fees. The remaining columns show the percent of profit for brokers A through F. Brokers noted with an asterisk charge flat-fees.
Immediately apparent in figure 2 is that percentage gains increases as the amount of invested capital increases, meaning the influence of fees is reduced as trading size grows. The model portfolio uses an investment size between $3000.00 and $4000.00 because of its varying size and strict money management rules.
To realize a profit with this small trading size is possible only with broker A. The same size traded with the other brokers would have produced substantial losses because of the higher fees. It must be mentioned that the brokers in this study are discount brokers with comparatively low fees. If other banks or brokers had been used the results would have been even more dramatic.
Investors with portfolios starting at $90,000.00 obtain best results with brokers offering flat rate fees (without considering money management). In this case broker B was the best choice. Here profits were possible with an investment starting as low as $40,000.00.
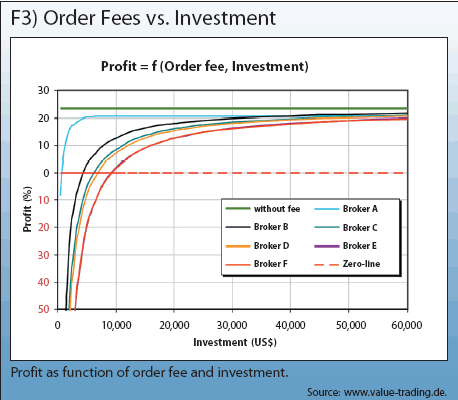
Figure 3 shows a graphic of the values from figure 2 using portfolio sizes up to $60,000.00. Retainable profits with brokers E and F are possible with an investment starting at $10,000. B and D are typical of brokers in the USA with very low cost fees. Broker A has an international presence and obviously offers the best conditions, at least as far as commissions are concerned.
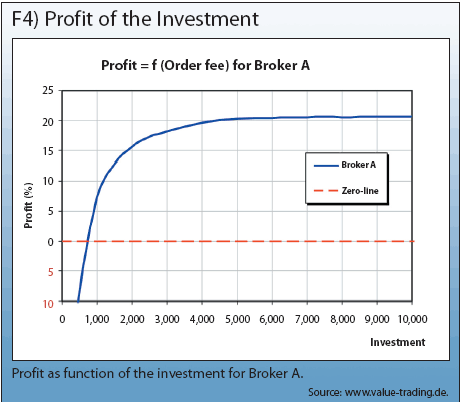
Even a minimum 5,000.00 investment is needed with broker B to avoid losses. With broker A profits are possible starting at $760.00. Figure 4 shows a magnified graphic of the profit curve for Broker A. With an investment of ca. $5,000.00 about 96.9% of possible profits can be retained. Traders with small accounts are served well here.
However, there are limits. With a $2,000.00 investment, only 15.6% profit can be retained from a possible 20.30%. That's only 66% of the maximum profit. The smaller investment size in this case leads to a 34% profit reduction.
It's a matter of survival for traders with little investment capital to find the right broker. This is even truer for beginners who typically start with small accounts. In that case, even a good strategy will produce losses if the "wrong" broker is used, causing the beginning
trader to give up in frustration.
This is especially clear in figure 5. Here the investment was a constant $5.000.00 except for the model portfolio (turquoise line). The top green curve (23.44%) shows performance without order fees. The blue curve displays performance using a low cost fee structure. The turquoise line (15.90%) shows the model portfolio's actual performance.
Even though the model account was traded with the most inexpensive broker, performance was lower. The reason being the amount of capital traded varied during the test period, account size was smaller than $5.000.00, and the broker first introduced the lowest cost fees on July 10, 2004 after the test had started (see Peripheral Factors).
The black line (1.32%) shows the best performance from the remaining brokers the red line (-23.80%), the worst performance. All others fall within that range.
Choice of Broker
There are just a couple of points to be made about choosing the right broker. Firstly, there is no right broker for all investors. A decision in favour of a certain broker basically depends on the following parameters:
That narrows the list of available brokers. But there are still major differences. Not all discount brokers offer all trading products. The minimum account size requirement also varies. It should be determined if short selling is possible, as some brokers don't offer it.
What order-types are available, does the trading platform appeal, and so on. Asking other traders about their experiences and opinions can also be helpful in making a decision.
As this article demonstrates, commission fees are a very important factor in trading success. Even when the broker fulfils all other requirements, if the fees are too high for the account size and trading style, success will remain elusive. That's why the importance of order costs cannot be emphasised enough.
Money-Management
The portfolio results listed here have a big influence on Money-Management. A standard rule states that invested capital should never exceed more than 50% of available capital. It has to be weighed if that rule can be followed considering general money management rules, the system's statistical results, and available capital.
If you choose to strictly follow that rule (which is advisable), then consequently it means a minimum account size of $10,000.00 is needed to achieve optimal performance (broker A only). For broker C, the second best broker in our test, a minimum account size of
$70,000.00 should be available. With broker C a $100,000.00 account is needed based on the results of the model portfolio.
Conclusion
The study clearly shows that broker commissions and account size strongly determine profitability. The level of commission fees is decisive for a trader's success or failure especially for small accounts, which is often the case for those getting started. Even if the trader follows a good strategy, in the end he will ruin his account and give up in frustration if the wrong broker is used.
An account size of $10,000.00 is the minimum needed for optimal results using the most basic money management rules and the "best" broker in our test.
Brokers offering flat rates are the best choice for accounts of more than $200,000.00.
These are not static limits, but are dependent on the trading system's total performance. The better the performance the smaller the account requirement. However, a trader must always exercise caution since trading performance is never constant and even the best
systems suffer drawdowns. That's why successful traders often warn against trading accounts that are too small.
Commissions are a very important criterion for choosing a broker, but by no means the only one. Quality and service also play an important role in the decision making process. The requirement for long-term success, of course, is a proven, robust trading system with plenty of statistical data supporting it, solid money management, and the discipline to trade the concept to the letter.
Brokers use various methods to determine their pricing structures. They are often based on either block pricing (i.e. number of stocks per trade, investment amount, trading activity) or fixed pricing, better known as flat rates (fees independent of number of stocks traded or investment amount). That's why investors should determine trading magnitude and frequency before making a short list of brokers. Of course, commissions are only one aspect to be weighed when considering a broker, but as will see it is a very important one.
The author publicly trades a small model portfolio (ca. $8000.00) on his web page using a well-known discount broker and a defined trading system. When analysing the results, it became apparent that order commissions substantially reduced profits.
Performance during a five-month period from the beginning of May 2004 through the end of September 2004 amounted to a respectable 23.44%. The actual profit after subtracting commission fees was 15.90%, a reduction of more than 32%. Even the most robust of strategies can hardly make up for this "loss". It became apparent that a more thorough analysis of order costs was needed.
Peripheral Factors
The above mentioned model portfolio contains only US stocks traded directly in New York, so the broker's current commissions for the USA were used in the calculations. Additional costs (such as exchange fees) were not considered.
Eight stock baskets containing ten stocks each were traded equally resulting in 80 trades. The original historical data of the model portfolio can be viewed under www.value-trading.de/trades.html.
Looking at the results on the web page, readers will note a couple interesting differences. There are two reasons behind this:
- Because of account fluctuation through profit and loss and the strict money management rules used, the eight baskets were allocated varying amounts of investment capital. However, capital was divided equally among the ten stocks within each basket (in the performance simulation presented here, the same amount of capital is allocated to each basket). A maximum 50% (5% per stock) of total available capital was invested as a rule.
- Two different commission fees were applied in the analysis because the broker used for the test changed its pricing schedule during the sample timeframe effective June 10, 2004.
For that reason it was necessary to determine the basic performance of the
trading system alone without consideration of order fees or money
management rules.
Performance Simulation
A simulation was conducted on the basis of basic system performance using an excel spreadsheet. For each broker a basket containing ten stocks was traded equally and the commissions for each transaction calculated. This was repeated using various levels of investment capital. The stocks and their buy and sell prices can be reviewed in the sample portfolio. The results are listed in figure 1.
Note that with varying portfolio performance the actual numbers diverge, that is to say a parallel displacement of the curves in figure 4 takes place either up or down, but the fundamental effect of order fees remains the same.
Commissions
The commissions used for each broker in figure 1 (understandably brokers are not named here) are taken directly from their websites. In some cases, commissions charged are dependant on the number of trades per time period (broker A and F). For these an average number of portfolio trades was used as a basis.
Results
The amount of investment capital listed in the first column of figure 2 applies to a single basket (10 stocks). The second column shows the percent of profit without commission fees. The remaining columns show the percent of profit for brokers A through F. Brokers noted with an asterisk charge flat-fees.
Immediately apparent in figure 2 is that percentage gains increases as the amount of invested capital increases, meaning the influence of fees is reduced as trading size grows. The model portfolio uses an investment size between $3000.00 and $4000.00 because of its varying size and strict money management rules.
To realize a profit with this small trading size is possible only with broker A. The same size traded with the other brokers would have produced substantial losses because of the higher fees. It must be mentioned that the brokers in this study are discount brokers with comparatively low fees. If other banks or brokers had been used the results would have been even more dramatic.
Investors with portfolios starting at $90,000.00 obtain best results with brokers offering flat rate fees (without considering money management). In this case broker B was the best choice. Here profits were possible with an investment starting as low as $40,000.00.
Figure 3 shows a graphic of the values from figure 2 using portfolio sizes up to $60,000.00. Retainable profits with brokers E and F are possible with an investment starting at $10,000. B and D are typical of brokers in the USA with very low cost fees. Broker A has an international presence and obviously offers the best conditions, at least as far as commissions are concerned.
Even a minimum 5,000.00 investment is needed with broker B to avoid losses. With broker A profits are possible starting at $760.00. Figure 4 shows a magnified graphic of the profit curve for Broker A. With an investment of ca. $5,000.00 about 96.9% of possible profits can be retained. Traders with small accounts are served well here.
However, there are limits. With a $2,000.00 investment, only 15.6% profit can be retained from a possible 20.30%. That's only 66% of the maximum profit. The smaller investment size in this case leads to a 34% profit reduction.
It's a matter of survival for traders with little investment capital to find the right broker. This is even truer for beginners who typically start with small accounts. In that case, even a good strategy will produce losses if the "wrong" broker is used, causing the beginning
trader to give up in frustration.
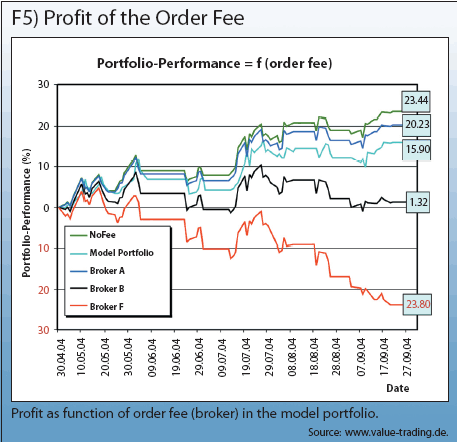
This is especially clear in figure 5. Here the investment was a constant $5.000.00 except for the model portfolio (turquoise line). The top green curve (23.44%) shows performance without order fees. The blue curve displays performance using a low cost fee structure. The turquoise line (15.90%) shows the model portfolio's actual performance.
Even though the model account was traded with the most inexpensive broker, performance was lower. The reason being the amount of capital traded varied during the test period, account size was smaller than $5.000.00, and the broker first introduced the lowest cost fees on July 10, 2004 after the test had started (see Peripheral Factors).
The black line (1.32%) shows the best performance from the remaining brokers the red line (-23.80%), the worst performance. All others fall within that range.
Choice of Broker
There are just a couple of points to be made about choosing the right broker. Firstly, there is no right broker for all investors. A decision in favour of a certain broker basically depends on the following parameters:
- Investor experience (can investment decisions be made independently or is professional consultation necessary?). This determines if a full service broker or a discount broker should be used.
- Service level (investment advice, trading platform, communications, dependability, execution speed, etc.)
- Tradable products (stocks, options, futures, currencies, etc.)
- Trading costs (commissions, account fees, etc.). The higher the trading frequency the more commissions will influence performance.
That narrows the list of available brokers. But there are still major differences. Not all discount brokers offer all trading products. The minimum account size requirement also varies. It should be determined if short selling is possible, as some brokers don't offer it.
What order-types are available, does the trading platform appeal, and so on. Asking other traders about their experiences and opinions can also be helpful in making a decision.
As this article demonstrates, commission fees are a very important factor in trading success. Even when the broker fulfils all other requirements, if the fees are too high for the account size and trading style, success will remain elusive. That's why the importance of order costs cannot be emphasised enough.
Money-Management
The portfolio results listed here have a big influence on Money-Management. A standard rule states that invested capital should never exceed more than 50% of available capital. It has to be weighed if that rule can be followed considering general money management rules, the system's statistical results, and available capital.
If you choose to strictly follow that rule (which is advisable), then consequently it means a minimum account size of $10,000.00 is needed to achieve optimal performance (broker A only). For broker C, the second best broker in our test, a minimum account size of
$70,000.00 should be available. With broker C a $100,000.00 account is needed based on the results of the model portfolio.
Conclusion
The study clearly shows that broker commissions and account size strongly determine profitability. The level of commission fees is decisive for a trader's success or failure especially for small accounts, which is often the case for those getting started. Even if the trader follows a good strategy, in the end he will ruin his account and give up in frustration if the wrong broker is used.
An account size of $10,000.00 is the minimum needed for optimal results using the most basic money management rules and the "best" broker in our test.
Brokers offering flat rates are the best choice for accounts of more than $200,000.00.
These are not static limits, but are dependent on the trading system's total performance. The better the performance the smaller the account requirement. However, a trader must always exercise caution since trading performance is never constant and even the best
systems suffer drawdowns. That's why successful traders often warn against trading accounts that are too small.
Commissions are a very important criterion for choosing a broker, but by no means the only one. Quality and service also play an important role in the decision making process. The requirement for long-term success, of course, is a proven, robust trading system with plenty of statistical data supporting it, solid money management, and the discipline to trade the concept to the letter.
Last edited by a moderator: