Seeking consistency

Re: eur aud

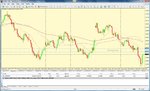
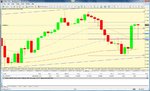
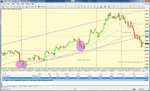
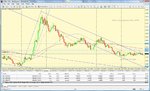
Trailing stop hit @1 44.70 (+160pips)

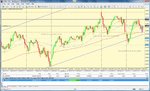
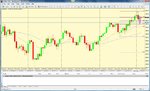
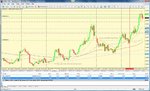
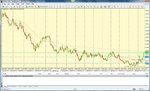
price has reached the top of my 4hr channel and printed a shooting star
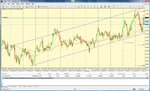
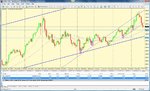
I am taking the short position with the Daily 20ma and daily trend against the 4hour moving averages.

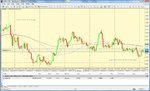
I will keep a close eye on this one and hope to be able to get to breakeven (if my order triggers) before the 4hour trend is proven to be the turning point against the daily (which is stronger, but also slower to react)
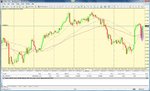
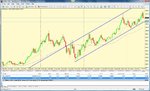
Here's my chart
 
aud usd 22Apr10

I have a four hourly hammer rejection of the Daily 20ema triggering a new long position on this pair this morning. This may be an entry into the Daily uptrend, however the 4hourly trend is bearish, because the 20ema is below the 50sma and the last swing high was a Lower high and the last swing low was a lower Low.

Is the 4 hourly is providing an early warning of a change in longer term sentiment?

I am taking the trade however, as Christian (@ Saxo) is suggesting a buy at 92.84.
Should I get past a good break-even stop, I am targeting the last daily swing high @ 93.80 (+100 vs -40)

let see what happens today
 

Attachments

  • aud usd 22 apr.10 set up.jpg
    aud usd 22 apr.10 set up.jpg
    135.5 KB · Views: 142
Re: aud usd 22Apr10

stop hit -40 pips

I have a four hourly hammer rejection of the Daily 20ema triggering a new long position on this pair this morning. This may be an entry into the Daily uptrend, however the 4hourly trend is bearish, because the 20ema is below the 50sma and the last swing high was a Lower high and the last swing low was a lower Low.

Is the 4 hourly is providing an early warning of a change in longer term sentiment?

I am taking the trade however, as Christian (@ Saxo) is suggesting a buy at 92.84.
Should I get past a good break-even stop, I am targeting the last daily swing high @ 93.80 (+100 vs -40)

let see what happens today
 
Re: aud usd 22Apr10

I have a second entry trigger for this pair, also rejecting the bottom of my ascending channel

If the four houly is giving an early indication of a change in the daily trend (from bullish) I'll take a further loss on the same pair in the same day

stop hit -40 pips
 

Attachments

  • aud usd 22 apr.10 set up ii.jpg
    aud usd 22 apr.10 set up ii.jpg
    131.1 KB · Views: 150
Re: aud usd 22Apr10

stop hit for -60 pips

I have a second entry trigger for this pair, also rejecting the bottom of my ascending channel

If the four houly is giving an early indication of a change in the daily trend (from bullish) I'll take a further loss on the same pair in the same day
 
eur usd

The euro has hit some new lows and is retracing this morning against many other currencies.

Here's the eur usd 4 hourly chart indicating the 50% and 61.8% fib levels of the previous down move, as a potential short zone
 

Attachments

  • eur usd 23 apr.10.jpg
    eur usd 23 apr.10.jpg
    112.1 KB · Views: 179
aud usd set up

4 hour trend is still up (4hr 20ema above 4hr 50sma and both above above daily 20ema) despite the last three weeks trading printing Lower Lows and Lower Highs

1hr hammer printed, potential entry to 4hr & daily uptrend - lets see (last 1hr hammer entry failed to trigger trade)
 

Attachments

  • aud usd 04 may.10 set up.jpg
    aud usd 04 may.10 set up.jpg
    132.9 KB · Views: 516
Re: aud usd set up

Trade not triggered and hammer now invalidated - order cancelled

4 hour trend is still up (4hr 20ema above 4hr 50sma and both above above daily 20ema) despite the last three weeks trading printing Lower Lows and Lower Highs

1hr hammer printed, potential entry to 4hr & daily uptrend - lets see (last 1hr hammer entry failed to trigger trade)
 
Gold

I haven't seen any potential trade triggers this week at or around the levels I anticipated pull-backs to stop and the price to continue in the direction of the main (4hour and daily) trends. In-fact theses long term trends themselves are looking as though they may be stalling or even reversing.

Anyway, on the daily timeframe I notice that Gold printed a bullish hammer yesterday indicating rejection of its daily 20ema. This has acted as support since the end of March, I am hoping to join the up trend when this candle is triggered and am hoping to hold up to the previous all time highs around 1225. I also have it as 50% retracement of the previous up-swing

FX500 club are similarly bullish (although at different levels) for fundamental as well as technical reasons, conversely Christian at Saxo is bearing for gold today!

Lets see what happens over the next week or two
 

Attachments

  • gold 06  may.10 set up.jpg
    gold 06 may.10 set up.jpg
    101.8 KB · Views: 1,534
nzd usd

this pair has been steadily climbing since early March

I have spotted a potential trigger to join it, from a combination of two 1 hour candles at the 61.8% fib pull back level of the previous 4H up move

I would have preferred an entry that was at or near the bottom of my ascending channel, but the moving averages on the Daily (20ema), 4 hourly (20ema & 50sma) and hourly (20 & 50) are all positioned in the correct format for a long trade, with the hourly having seen this morning the 20ema cross up through the hourly 50sma (golden cross) and the 4 hourly 20ema (silver cross)

Lets see what happens
 

Attachments

  • nzd usd 06  may.10  4h trend.jpg
    nzd usd 06 may.10 4h trend.jpg
    136.1 KB · Views: 228
  • nzd usd 06  may.10 set up.jpg
    nzd usd 06 may.10 set up.jpg
    115.6 KB · Views: 632
  • nzd usd 06  may.10  4h fib.jpg
    nzd usd 06 may.10 4h fib.jpg
    115.5 KB · Views: 189
USD CAD long - Entry II

I haven't posted for a while, which with the benefit of hindsight is stupid because my original reason for establishing a blog was to make me think through my trades and ensure that I was following my stated 'rules'.

Needless to say, what was a growing account since the start of this thread has shrunk considerably as I have been attempting to catch the big moves following the rapid fall & bounce on the indices on Thursday 6th May.

So, here's a 'good' trade I entered earlier in the week, having seen the USD CAD Daily time frame turn bullish between the 6th & 13th (20ema crossing up through 50sma and higher low printed), I waited for the 4 hourly timeframe to retrace a little and the four hour 20ema cross up through the 4 hourly 50sma and the daily 20ema (part one of my entry set up) I then waited for a new high on the 4hourly to be reached, then a retrace to between 50% and 61.8% of the 4 hourly up move to look for an entry trigger (long) on the 4hourly or shorter timeframes. This I got at on Tuesday afternoon.

Fortunately I was very lucky and the trade performed well overnight and I was able to move my stop to a breakeven position Wednesday morning.

It has motored upward nicely and I am risking a second entry (I appreciate we may have double topped' with the spike high from May 6th) with the 6am bar this morning being a hammer that looks to me as if it is demonstrating the hourly 20sma is confirmed as support (which it pretty much has been all week)

Lets see what today holds (CAD news at midday & 130pm UK time, with some more good luck luck I'll be able to put my stop to breakeven before the first news, as I would normally expect a re-entry to be offered at the level of the 4H 20ema or even between the 4H 20 ema & H4 50sma, which is considerably lower than this mornings 1H trigger
 

Attachments

  • usd cad 21  may.10  add trade.jpg
    usd cad 21 may.10 add trade.jpg
    137.3 KB · Views: 191
Gold - daily bull channel failed - what about the weekly one?

I have been following gold up for a while as it has been holding in a channel. However, unless today sees a big recovery, my channel (4 hour & daily) has been broken

I have looked back in time and see that there is also a weekly channel, indicating an entry (long) in the next week or so at around 1130. Will it go that low & then 'bounce'?
 

Attachments

  • gold (4h)  21  may.10.jpg
    gold (4h) 21 may.10.jpg
    129.2 KB · Views: 145
  • gold (d)  21  may.10.jpg
    gold (d) 21 may.10.jpg
    126.4 KB · Views: 156
  • gold (w)  21  may.10.jpg
    gold (w) 21 may.10.jpg
    114.1 KB · Views: 172
Re: USD CAD long - Entry II

Stop to BE, but I do expect this to be hit as price hasn't moved much all morning, so I am only 20 points clear of my entry level - news could easily 'spike' down and close my trade, but better safe than sorry. I think the hourly chart has formed a bull flag (swing lows at the same Support level and lower swing highs forming a downward diagonal resistance line thats waiting to be broken through)

Lets see what today holds (CAD news at midday & 130pm UK time, with some more good luck luck I'll be able to put my stop to breakeven before the first news, as I would normally expect a re-entry to be offered at the level of the 4H 20ema or even between the 4H 20 ema & H4 50sma, which is considerably lower than this mornings 1H trigger
 
Re: USD CAD long - closes

Stop to BE
hourly chart has formed a bull flag

My lucky day, both trades have hit my target level of 1.075 post the midday news reaction.
I identified this target as the last 4H swing high (May 6th) together with the descending daly Trend Line from summer '09 (attached)

Trade 1 entry 1.03 15 target 1. 07 5
Trade 2 entry 1.06 65 target 1. 07 5

+435 +85 = 520
 

Attachments

  • usd cad 21  may.10  closes.jpg
    usd cad 21 may.10 closes.jpg
    114.8 KB · Views: 143
No Posts

Hi

I haven't posted to my blog for a few weeks because I haven't seen any set ups that comply with the criteria I outlined on my initial post

Essentially the Daily trend (which I take from the relative position of the 20ema and 50sma) has not been in alignment with the 4 Hourly trend

This is the first thing I am looking for, then I like to see (if my Daily and 4 Hourly trends are both long) the 4H 20ema to be higher than the Daily 20ema and for price to be above both of the 20emas.

As prices spend the majority of the time ranging, I suppose I should not be surprised that I can't find any potential set ups for this strategy.

I suppose the thing to be mindful of is opportunities to trade 'within the range' (essentially the classic 'buy low sell high, sell high buy low' trade)

I will try to review my charts from this perspective, if my initial analysis returns a 'no trade' result, from now on
 
Gbp cad

Ironically here's a potential set up

Daily trend is down, 4 Hour trend is down

Price has retraced 61.8% of its previous down move and posted a 4 hourly 'trigger' candle (shooting star)

Opening risk = -50, target return (@1.49 00) = +230

No major news scheduled for either currency until 9:30am tomorrow (gbp)

Here is my 4 hourly chart showing the 'trigger' for my trade. Lets see what this looks like before the news tomorrow
 

Attachments

  • gbp cad 14  jun.10  set up.jpg
    gbp cad 14 jun.10 set up.jpg
    118.5 KB · Views: 558
Eur aud

The daily moving averages that I look at have just crossed to the short side, aligning them with the 4H trend

I have a trigger (shooting star) on the hourly chart at 61.8% retrace of the previous, admittedly relatively small 4H downward move

I entered the position yesterday and it has moved very little over night. There is no news today, so I am waiting to see how this pair close the week
 

Attachments

  • eur aud 17  jun.10  set up.jpg
    eur aud 17 jun.10 set up.jpg
    140.3 KB · Views: 597
Top