WSNC - Wilson Connolly Homes

Messages
549
Likes
2
Wilcon seems to be forming a symmetric triangle - it has a nice decreasing volume trend and is most likely to act as a continuation pattern.

Current price is 165.5p with a downside target of 135p.
 

Attachments

  • draw_chart.png
    draw_chart.png
    8.3 KB · Views: 323
i am no expert on TA and am trying to learn more

could you please explain to me why the combination of a symmetric triangle and weak volume would indicate that the shares are more likely to go down than up?

also how do you form a view of a 135p target?
 
the two converging trend lines that form the triangle are the result of two groups of people that are buying and selling the stock . These are processes of accumulation and distribution as the consolidation formation forms and the crowd loses interest in the stock until the forces acting on it resolve and the price begins to move again.

Symmetric triangles are less easy to predict than ascending and descending however on balance they act as continuation formations.

The measuring riule take sthe height of the triangle (top to bottom) and adds/subtracts it to/from the top/bottom to get a target.

They can also act as halfway points on a measured move.

Suggest you look at Edwards and Mcgee or Bulkowski for more information.

It's best to wait for the breakout before entering a trade...
 
thank you for your guidance....i think your last point about waiting for a breakout is key here
 
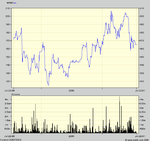
BTW, looking at this chart has prompted to think about risk/reward ratio, spreads and the instrument for trading this type of chart.

My usual spread betting company charges a spread as a means of taking commision (which is fair enough IMOH) and therefore this may significabtly impact the risk reward ratio (based on my stop loss and target prices) - effectively my price objective is reduced by the spread.

There is an additional charge for using a controlled risk trade which reduces the risk reward ratio even further. I'm currently looking to use unlimited risk trades in the future.

However I would be interested to hear from CFD traders what the chardes/spread might be.

TIA.
 
WSNC - Wislon Connolly Homes

for what it is worth here is tuppenyworth of comment.

from my limited experience from looking at spreadbetters (and bearing in mind that nothing is ever black and white) it would seem to me that the wider spread would efectively be equivalent to paying stamp. sure you might have a longer period over which you can hold the position than a traditional broker but you should be able toal T+10 with any broker at the touch price of even better.

for shorter term traders my experience is that if the trade has not worked by T+10 then it could take some time.

my preferred route is to go to someone like gni where you can deal on the touch / go best bid or offer on a screen in front of you. you are not paying any premiums anywhere and it can't be any more risky than dealing with a spread betting firm.

if i have got it wrong about spread betting firms then no doubt someone will put me right.

hope this helps
 
I guess it might help to put some numbers on things.

for instance if you typically pay a 10p spread plus another 10p for controlled risk, then on a stock that costs 160p you might have a target that is + or - 40p and a stoploss near the entry point (say 10p).

with traditional brokers then if you have a large enough stake the stamp duty doesn't matter and you might pay (say) 30 quid to buy and the same to sell. assuming that the stock meets your target you can make 25% minus 60 quid costs.

with spread betting the 20p controlled risk spread has eaten away 50% of the profits and it just isn't worth making the trade!
 
Top