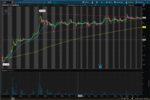
Good Morning, I was wondering if someone can help me interpret this chart? I'm a beginning trader. Is this an ascending triangle? or a pointed flag? its on a 90 day chart and the volume is decreasing. same for the 20 day chart it shows a more symmetrical triangle with the consolidation i'm assuming instead of a breakout though it will drop in price because of the decreasing volume? or is this typical of a consolidation triangle? and I have to just wait for a breakout?


