Can you show some examples of this? (the bold underlined section) to show that there is a higher probability of a continuation rather than say reversing after a volume spike?
Your last 2 sentences:
Is it the fact that price doesn't matter or volume? See, its interesting from the perspective you view it. Volume is a complex area, and means nothing without context and relationship. Spikes are a small part of it, and too much is made of this one aspect.
You dont need volume to trade, but it can add more information if you do get a decent grasp of it. We trade the price, how we come to the decision is up to the individual.
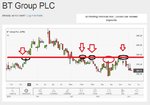
Anyway thats for another thread, Barjon has stated the idea is to use TA as a tool and see what we can get from it. Lets see where BT goes in the next few weeks.