Wot happened next?

barjon

Legendary member
Messages
10,752
Likes
1,863
Anything to please wasp :cool:

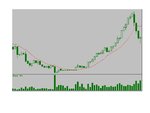
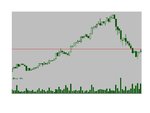
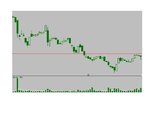
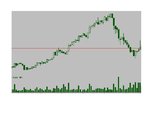
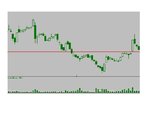
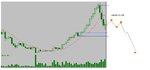
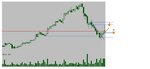
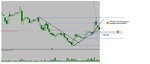
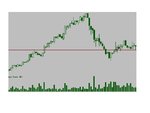
ok here's the plot. You work with a trading decision time frame, but consult a higher time frame for significant s/r levels etc and a lowertime frame for fine-tuning entries and exits.

You've been reading trader dante's thread and spot an interesting hammer appearing on your higher time frame chart which has terminated at fib50% of the whole up move (chart 1 - last candle). At this time your trading time frame and lower time frame charts look like charts 2 and 3 (the horizontal red being the high of the hammer).

At this stage you might ask yourself if you are considering a trade. If so, what's your plan of campaign, when and at what level are you going to enter and where is your stop going to be?

That, however, is not the main point of this particular wot? so read on................
 

Attachments

  • wot1.JPG
    wot1.JPG
    44.1 KB · Views: 268
  • wot2.JPG
    wot2.JPG
    42 KB · Views: 285
  • wot3.JPG
    wot3.JPG
    40.9 KB · Views: 283
Please read the first post first

Well, our trader decides to trade and enters at just above the hammer high with a stop just below its low.

All goes well for a time but the entry candle on his trading decision time frame finishes as a shooting star having reacted at fib38% of the down move (chart 1).The lower time frame is chart 2. Gulp, wot to do?

Over to you.

good trading

jon
 

Attachments

  • wot4.JPG
    wot4.JPG
    46 KB · Views: 258
  • wot5.JPG
    wot5.JPG
    43.5 KB · Views: 257
Personally I don't like to trade against increasing volume in a retracement unless its just a big spike into resistance (higher timeframe chart in first post) so I'm watching and wondering but not committed.
 
Hi Jon!

All just for me, aw shucks and thanks!

Well, my 2 cents are as shown.

I would still be long, looking to trade up to the next resistance and keeping on an eye on the trendlines, waiting for a break to exit and possibly reverse. I expect congestion for a little while before a continuation in the down move.

Chris
 

Attachments

  • w.JPG
    w.JPG
    49.7 KB · Views: 249
  • w1.jpg
    w1.jpg
    47.8 KB · Views: 243
  • w2.jpg
    w2.jpg
    54.6 KB · Views: 277
Don't be shy now people! The more input the more informative for all, right or wrong... we can accept losses in the market so no ones ego should be bruised on an internet forum!
 
Do nothing yet. The plan to enter immediately above the hammer is good, with a stop immediately below. The shooting star is a bearish indication but not an exit signal from the long, nor an entry signal for a short. referencing my own Rule 2 - Plan the trade, trade the plan. But its a good time to review your risk management e.g. such that a total stop will not cost more than 2% of trading capital.
 
I'm assuming the left hand side chart is the highest time frame chart.

On this basis, the downtrend candles are large in size and volume has increased as Nine & Wasp have said. Therefore, I would view this downtrend as a reversal rather than a retracement.

The hammer type bar would be a counter trend trade. Not worth it. I'd wait for an ABC correction to the next lower support zone and then see what the market tells me.
 
Panic.
Buy more.
Pray.
Hi t_d,
I do hope your new employer's don't read this post. When you assured them at interview that each and every trade you execute is meticulously researched and planned, somehow, I rather doubt that this is what they had in mind.:cheesy:
Tim.
 
Hi t_d,
I do hope your new employer's don't read this post. When you assured them at interview that each and every trade you execute is meticulously researched and planned, somehow, I rather doubt that this is what they had in mind.:cheesy:
Tim.

LOL
 
Obviously some people don't realise that my post above is a joke...

Just to clarify: it is :)
 
well i liked it, tom :LOL:

i'll move it along to the next stage tomorrow if no-one has any more comments so far.

good trading

jon
 
ok, just to re-cap. You have a three chart approach with a primary trading time frame supported by a higher time frame for identifying significant longer term elements and a lower time frame for fine tuning entries and exits. You spotted a hammer after a retracement on your higher time frame and you've traded it and you are monitoring the trade via your trading time frame.

On this trading time frame you gulped when the entry bar finished up as a shooting star type candle and look worrisome. On with the story:

You will see from the chart that you would have been stopped out for a small loss if you'd lifted your stop to the low of that worrisome candle before the price immediately took off in the right direction (curses - they've hunted my stop again :devilish:). Assuming you had not lifted your stop to that degree, if at all, then you arrive at this point (see chart). Wot next? Any decisions/plans?

good trading

jon

ps: Something I've said in this post should be beginning to grate. Any thoughts?
 

Attachments

  • wot6.JPG
    wot6.JPG
    43.2 KB · Views: 246
I'm assuming the left hand side chart is the highest time frame chart.

On this basis, the downtrend candles are large in size and volume has increased as Nine & Wasp have said. Therefore, I would view this downtrend as a reversal rather than a retracement.

The hammer type bar would be a counter trend trade. Not worth it. I'd wait for an ABC correction to the next lower support zone and then see what the market tells me.

i agree.

the hammer and any small continuation is likely to be some profit taking from those who went short and people who are mug enough to buy fib levels as soon as they are hit. saying that, a fib level is often a good place to take profit as there is sometimes a correction that could progress into a reversal.

i should point out i havent followed dantes thread.

id also want to get a fuller picture. was the sell off starting on a news story? how significant was it? did the top before the decline started poke through a key number or level? etc
 
Top